925 homes traded hands last month via LSTAR's MLS® system, marking the second best August for home sales since LSTAR started tracking data, back in 1978. However, the pace of sales was slower than in August 2020, with the median number of days spent by a home on the market sitting at 9, compared to only 8 days last year.
"The number of August residential transactions decreased by 4.3% over the same period last year, but, despite this slight change of pace, average and benchmark prices continued to climb," said 2021 LSTAR President Jack Lane. "The overall average home price in LSTAR's jurisdiction for August 2021 was $620,002, and the composite benchmark price - $586,800. These increases were undoubtedly caused by the very low housing supply and the sky-high demand," he added.
The following table shows how August's average sales prices compare to the benchmark prices. The MLS® Home Price Index (HPI) benchmark price reflects the value of a "typical home" from a certain area as assigned by local home buyers based on various housing attributes. The average sales price is calculated by adding the sale prices for all the homes sold and dividing that total by the number of transactions. Since monthly averages may be skewed by the type of houses sold in that timeframe, the HPI benchmark price is a more accurate way to gauge price trends.
|
Area |
August 2021 MLS® HPI Benchmark Price |
August 2021 Average Price |
|---|---|---|
| Elgin | $611,600 | $603,624 |
| London East | $507,300 | $483,920 |
| London North | $697,300 | $732,936 |
| London South | $579,400 | $635,096 |
| Middlesex | $869,300 | $888,272 |
| St. Thomas | $503,400 | $566,320 |
| Strathroy | $680,000 | $603,415 |
| LSTAR | $586,800 | $620,002 |
"Beside prices, when analyzing the market activity in LSTAR's five main regions, we are also looking at the Sales-to-New-Listings ratio recorded in each region. The higher this ratio is, the more that region favours Sellers," he pointed out. "Currently, all LSTAR's regions are firmly anchored in Sellers' territory, with London seeing the highest ratio – 94.6%, followed by St. Thomas – with 90.1%," he emphasized.
"Speaking of St. Thomas, it's important to note that last month was the best August for home sales in the history of the Railway City, with 82 units sold," Lane said.
In total, LSTAR saw 1,020 new listings last month, 1.4% less than in August 2020. The overall number of months of inventory continued to decrease, reaching a new record low at the end of August: 0.6. "This means that, at the current rate of sales activity, it would take less than a month to liquidate the entire existing housing inventory of LSTAR," Lane explained.
The single-family home remains the favourite house type of local buyers, with 682 sales in August. "Nevertheless, it is worth mentioning that apartments had their best August ever, with 83 units exchanging hands last month," Lane noted.
The table below shows the August benchmark prices for all housing types in LSTAR's jurisdiction and how they stack up against the values from a year ago.
|
MLS® Home Price Index Benchmark Prices |
||
|---|---|---|
|
Benchmark Type |
August 2021 |
Change over August 2020 |
| LSTAR Composite | $586,800 | ↑ 32.9% |
| LSTAR Single-Family | $634,000 | ↑ 34.3% |
| LSTAR One Storey | $583,800 | ↑ 37.6% |
| LSTAR Two Storey | $682,500 | ↑ 32.2% |
| LSTAR Townhouse | $483,100 | ↑ 38.1% |
| LSTAR Apartment | $319,300 | ↑13.1 % |
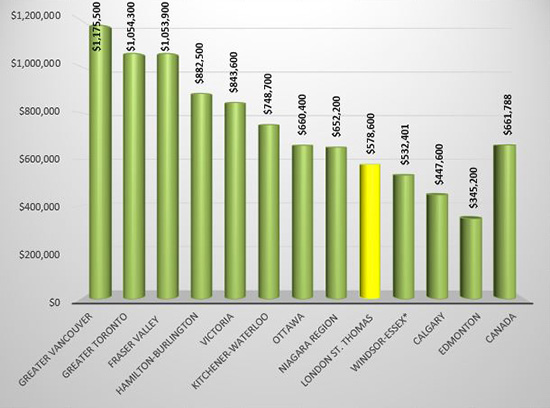
Despite all the increases seen in the HPI benchmark prices and average sales prices, homes in LSTAR's jurisdiction appear to be relatively affordable when compared to houses from some other major Ontario and Canadian centres. The following chart is based on data taken from the CREA National Price Map for July 2021.
According to a research report[1], a total of $73,250 in ancillary expenditures is generated by the average housing transaction in Ontario over a period of three years from the date of purchase. "In other words, our August home sales could potentially generate more than $67 million for the local economy over the next few years," Lane concluded.
[1]Economic Impacts of MLS® Systems Home Sales and Purchases in Canada and the Provinces, Altus Group, 2019.


