The London and St Thomas Association of REALTORS® (LSTAR) announced 536 homes* were sold in February, down 32.8% over the same period last year, which holds the record for best February results since LSTAR began tracking sales data in 1978.
"Inventory, or Active Listings, continues to experience a dramatic decrease compared to 2017, which is having a huge impact on sales," said Jeff Nethercott, 2018 LSTAR President. "There were 1,103 active listings, down 26.4% from this time last year. This is the lowest level of inventory we’ve had in the region over the last 10 years."
Although inventory remains low, average home sales price in London and St. Thomas continues to rise. The average February sales price in the region was $349,848, up 10.8% over February 2017. By geographic area, London South was $375,329, up 15.3% from last February. In London North, average home sales price was $424,959, up 14.5% compared to the previous year, while in London East, it was $286,770, an increase of 10.5% from February 2017. In St. Thomas, it was $307,383, up 27.4% over last February.
"One of the other factors we look at is the sales-to-new listings ratio," Nethercott said. "According to the Canadian Real Estate Association (CREA), a ratio between 40% and 60% is generally consistent with a balanced housing market. In February, London and St. Thomas had a sales-to-new listings ratio of 69.5%, which CREA says represents conditions in the marketplace that favour sellers. It illustrates the high demand and low supply trend currently happening in the region."
St. Thomas saw a total of 52 homes sold in February, down 25.7% from the same period last year. When looking at inventory, there were 71 active listings, down 32.4% from last February.
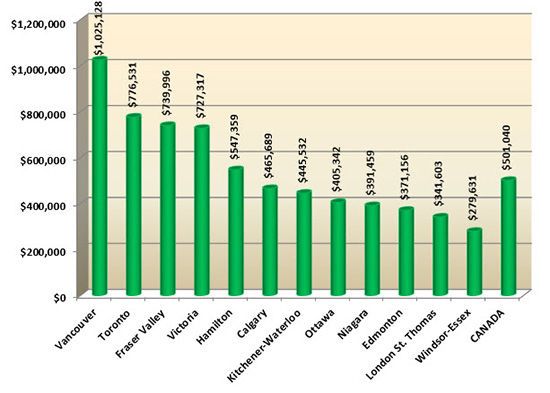
The following chart is based on data taken from the CREA National MLS® Report for January 2018 (the latest CREA statistics available). It provides a snapshot of how average home prices in London and St. Thomas compare to other major Ontario and Canadian centres.
According to a research report1, one job is created for every three real estate transactions and approximately $53,000 in ancillary spending is generated every time a home changes hands in Ontario. “Based on February sales, that translates into creating approximately 178 jobs and potentially generating more than $28 million back into the local economy,” Nethercott said.
The London and St. Thomas Association of REALTORS® (LSTAR) exists to provide its REALTOR® Members with the support and tools they need to succeed in their profession. LSTAR is one of Canada's 15 largest real estate associations, representing over 1,700 REALTORS® working in Middlesex and Elgin Counties, a trading area of 500,000 residents. LSTAR adheres to a Quality of Life philosophy, supporting growth that fosters economic vitality, provides housing opportunities, respects the environment and builds good communities and safe neighbourhoods and is a proud participant in the REALTORS Care Foundation’s Every REALTOR™ Campaign.
*These statistics are prepared for LSTAR by the Canadian Real Estate Association (CREA) and represent a data snapshot taken on March 1, 2018, based on reported sales activity between February 1 and 28, 2018.
1. [Economic Impacts of MLS® System Home Sales and Purchases in Canada and the Provinces, Altus Group Consulting, 2013.]


