The London and St Thomas Association of REALTORS® (LSTAR) announced 400 homes* were sold in January, down 28.8% over the same period last year, which holds the record for best January results since LSTAR began tracking sales data in 1978.
"When you take a look at the last 10 years, these results are right in line with the activity we expect in January," said Jeff Nethercott, 2018 LSTAR President. "One of the areas affecting home sales is low inventory. There were 623 new home listings, down 31.8% from last January, and there were 1,020 active listings, down 27.7% from this time last year.”
Average home sales price continues to rise across London and St. Thomas. The average sales price in the region was $333,424, up 9.8% over the same period last year. By geographic area, London South was $351,167 up 11.5% from last January. In London North, average home sales price was $397,075 up 6.2% compared to the previous year, while in London East, it was $294,348, an increase of 32.1% from January 2017. In St. Thomas, it was $247,135, up 19.7% over last January.
"One of the other factors impacting home sales was weather, with the region experiencing harsher winter conditions compared to last January," Nethercott said. "We also have to consider the tighter mortgage regulations that took effect on January 1. In the coming months, it'll be interesting to see what impact this may have on monthly sales activity, here in our local communities and throughout Canada."
St. Thomas saw a total of 30 homes sold in January, down 36.2% from the same period last year. When looking at inventory, there were 66 active listings, down 34.7% from last January, and there were 46 new listings, down 32.4% from the previous year.
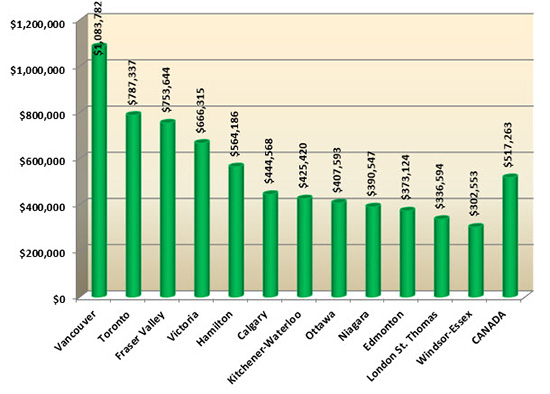
The following chart is based on data taken from the CREA National MLS® Report for December 2017 (the latest CREA statistics available). It provides a snapshot of how average home prices in London and St. Thomas compare to other major Ontario and Canadian centres.
According to a research report1, one job is created for every three real estate transactions and approximately $53,000 in ancillary spending is generated every time a home changes hands in Ontario. “Based on the sales in January, that translates into creating approximately 133 jobs and positioning us to potentially generate more than $21 million back into the local economy,” Nethercott said.
The London and St. Thomas Association of REALTORS® (LSTAR) exists to provide its REALTOR® Members with the support and tools they need to succeed in their profession. LSTAR is one of Canada’s 15 largest real estate associations, representing over 1,700 REALTORS® working in Middlesex and Elgin Counties, a trading area of 500,000 residents. LSTAR adheres to a Quality of Life philosophy, supporting growth that fosters economic vitality, provides housing opportunities, respects the environment and builds good communities and safe neighbourhoods and is a proud participant in the REALTORS Care Foundation's Every REALTOR™ Campaign.
*These statistics are prepared for LSTAR by the Canadian Real Estate Association (CREA) and represent a data snapshot taken on February 1, 2018, based on reported sales activity between January 1 and 31, 2018.
1. [Economic Impacts of MLS® System Home Sales and Purchases in Canada and the Provinces, Altus Group Consulting, 2013.]


