London and St Thomas Association of REALTORS® (LSTAR) announced 861 homes* were sold last month, marking the second best September for home resales, since the Association began tracking data in 1978.
"In September, home resales across the region were up 11.8%, compared to the same month last year," said Earl Taylor, 2019 LSTAR President. "With three months left in the year, almost 8,000 homes have exchanged hands, which is up 3.6%, compared to this period in 2018."
Meanwhile, inventory remains low, with active listings at 1,841, up 8.8%, compared to September 2018. This number is well below the 10-year average. For comparison, this is down 22.6% compared to three years ago and down 49.6% compared to five years ago.
"What we're experiencing with low inventory has had an impact on the average home sales price," Taylor said. "Each of the five major areas in LSTAR's jurisdiction saw an increase last month. It was up 20.4% in Elgin County, up 6.6% in Middlesex and up 6.5% in Strathroy. London and St. Thomas also saw gains, up 5.1% and 4.3% respectively."
Overall, the average home price was $412,208. It represents an increase of 6.8% from September 2018 but is almost on par with the average sales price of $413,010 from August.
|
Area |
September Average Sale Price |
|---|---|
| Elgin County | $426,992 |
| London | $410,930 |
| Middlesex County | $504,172 |
| St. Thomas | $335,374 |
| Strathroy | $406,426 |
| LSTAR | $412,208 |
Looking closer at London by geographic area, the average price in London East was $343,404, up 13.7% from last September. In London South (which includes data from the west side of the city), the average home sales price was $406,388, up 5.4% compared to the previous year, while London North saw a slight decrease of 2.2% over last September, with an average home sales price of $485,102.
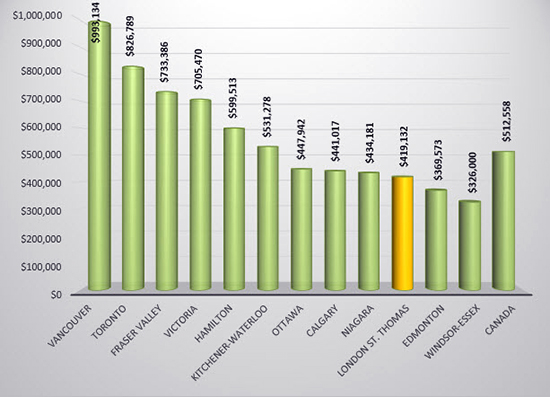
The following chart is based on data taken from the Canadian Real Estate Association (CREA) National MLS® Report for August 2019 (the latest CREA statistics available). It provides a snapshot of how average home prices** in London and St. Thomas compare to some other major Ontario and Canadian centres.
According to a research report1, a total of $67,425 in ancillary expenditures is generated by the average housing transaction in Ontario over a period of three years from the date of purchase. "Based on the home resales in September, that's generating potentially more than $58 million back into the local economy for the next few years," Taylor said.
The London and St. Thomas Association of REALTORS® (LSTAR) exists to provide its REALTOR® Members with the support and tools they need to succeed in their profession. LSTAR is one of Canada's 15 largest real estate associations, representing over 1,700 REALTORS® working in Middlesex and Elgin Counties, a trading area of 500,000 residents. LSTAR adheres to a Quality of Life philosophy, supporting growth that fosters economic vitality, provides housing opportunities, respects the environment and builds good communities and safe neighbourhoods and is a proud participant in the REALTORS Care Foundation’s Every REALTOR™ Campaign.
*These statistics are prepared for LSTAR by the Canadian Real Estate Association (CREA) and represent a data snapshot taken on October 1, 2019, based on processed home sales activity between September 1 and 30, 2019.
**Seasonal adjustment is widely used in CREA’s statistics as a technique for enabling timely interpretation of data. The purpose of seasonal adjustment is to remove systematic calendar-related variations associated with the time of the year (seasonal effects).
1 Economic Impacts of MLS® Systems Home Sales and Purchases in Canada and the Provinces, Altus Group Economic Consulting, 2017


