For the second month in a row, LSTAR's home resales achieved a new record, with 752 homes1 exchanging hands in November. It's the best November ever, since the Association began tracking data in 1978.
"We had another solid month, demonstrating the robust marketplace all across the region," said Earl Taylor, 2019 LSTAR President. "There have been 9,658 home resales year to date, which is up 3.2% compared to the same period in 2018, and we're on course to surpass last year's total sales."
The sales-to-new listings ratio in LSTAR's jurisdiction was 90.7%, which the Canadian Real Estate Association (CREA) says favours sellers. A ratio between 40% and 60% is generally consistent with a balanced market. A ratio below 40% tends to favour buyers, while a ratio higher than 60% indicates marketplace conditions favouring sellers, according to CREA.
"Several regions saw sales-to-new listings ratios above 100%, including London East (105.6%) and Strathroy (107.1%),” Taylor said. "We're still experiencing low inventory levels, which also continues to impact the average home sales price in all regions."
Overall, the average home price was $416,116, up 10.6% compared to November 2018.
|
Area |
November Average Sale Price |
|---|---|
| Elgin County | $417,206 |
| London | $426,887 |
| Middlesex County | $514,016 |
| St. Thomas | $327,731 |
| Strathroy | $400,727 |
| LSTAR | $416,116 |
Looking at London’s three main geographic areas, the average home price in London East was $357,796, up 18.6% from last November. In London South (which includes data from the west side of the city), the average home sales price was $424,900, up 12.2% compared to the previous year, while London North saw an increase of 1.9% over last November, with an average home sales price of $493,896.
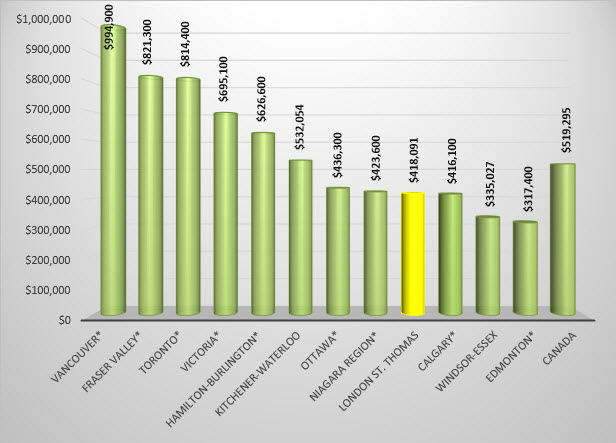
The following chart is based on data taken from the CREA National Price Map for October 2019 (the latest CREA statistics available). It provides a snapshot of how home prices in London and St. Thomas compare to some other major Ontario and Canadian centres.
According to a research report2, a total of $67,425 in ancillary expenditures is generated by the average housing transaction in Ontario over a period of three years from the date of purchase. "Looking at the November home resales, that means potentially generating more than $50 million right back into the local economy," Taylor said. "The business of residential real estate impacts all facets of our community, from professional services, such as legal and appraisal entities, to retail, as well as local contractors and tradespeople."
The London and St. Thomas Association of REALTORS® (LSTAR) exists to provide its REALTOR® Members with the support and tools they need to succeed in their profession. LSTAR is one of Canada's 15 largest real estate associations, representing over 1,900 REALTORS® working in Middlesex and Elgin Counties, a trading area of 500,000 residents. LSTAR adheres to a Quality of Life philosophy, supporting growth that fosters economic vitality, provides housing opportunities, respects the environment and builds good communities and safe neighbourhoods and is a proud participant in the REALTORS Care Foundation’s Every REALTOR™ Campaign.
*Areas displaying MLS® Home Price Index benchmark prices; all other areas display average prices
1These statistics are prepared for LSTAR by the Canadian Real Estate Association (CREA) and represent a data snapshot taken on December 1, 2019, based on processed home sales activity between November 1 and 30, 2019.
2Economic Impacts of MLS® Systems Home Sales and Purchases in Canada and the Provinces, Altus Group Economic Consulting, 2017.

