The London and St. Thomas Association of REALTORS® (LSTAR) announced another strong month for home sales in October, with 865 homes exchanging hands. Although down 7.1% compared to the same time a year ago, sales represent the second-highest number of homes sold in the month of October since 1978.
"During the fall season, the sales activity in LSTAR's jurisdiction has been well above the 10-year average," said Jack Lane, LSTAR 2021 President. "High demand and low supply continue to make this a very competitive marketplace. If you're considering listing your home or purchasing a home, your local REALTOR® is the best resource to help navigate through this ever changing marketplace."
An important area to highlight is inventory, which shows how long it would take to liquidate existing inventories at the current rate of sales activity.
"At the end of October, there were only 0.6 months of inventory, which is lower than the 0.9 months of inventory reported in the same period a year ago," Lane said. "To put it in perspective, about four months of inventory would represent a balanced marketplace. Out of LSTAR's main areas, St. Thomas and London North had the lowest housing supply, with only 0.4 months of inventory. Central Elgin had the highest supply with 1.4 months."
The low supply levels continue to affect the benchmark and average sales prices. In October, the overall average home price for LSTAR was $672,328, while the LSTAR composite MLS® HPI benchmark price sat at $613,900.
The following table shows how October’s average sales prices compare to the benchmark prices. The MLS® Home Price Index (HPI) benchmark price reflects the value of a "typical home" from a specific area as perceived by local home buyers based on various housing attributes. The average sales price is calculated by adding the sale prices for all the homes sold and dividing that total by the number of transactions. Since monthly averages may be skewed by the type of houses sold in that timeframe, the HPI benchmark price is a more accurate way to gauge price trends.
|
Area |
October 2021 MLS® HPI Benchmark Price |
October 2021 Average Price |
|---|---|---|
| Central Elgin | $641,300 | $823,556 |
| London East | $533,800 | $518,997 |
| London North | $725,800 | $778,712 |
| London South | $605,300 | $648,206 |
| Middlesex Centre | $904,900 | $1,043,965 |
| St. Thomas | $522,800 | $593,517 |
| Strathroy-Caradoc | $717,400 | $714,795 |
| LSTAR | $613,900 | $672,328 |
The single-family home remains on top of the local buyers' preferences, with 649 sales in October. The table below shows the October benchmark prices for all housing types in LSTAR's jurisdiction and how they stack up against the values from a year ago.
|
MLS® Home Price Index Benchmark Prices |
||
|---|---|---|
|
Benchmark Type |
October 2021 |
Change over October 2020 |
| LSTAR Composite | $613,900 | ↑ 33.3% |
| LSTAR Single-Family | $664,600 | ↑ 34.4% |
| LSTAR One Storey | $619,600 | ↑ 38.1% |
| LSTAR Two Storey | $709,700 | ↑ 32.1% |
| LSTAR Townhouse | $487,100 | ↑ 35.8% |
| LSTAR Apartment | $349,800 | ↑ 20.3 % |
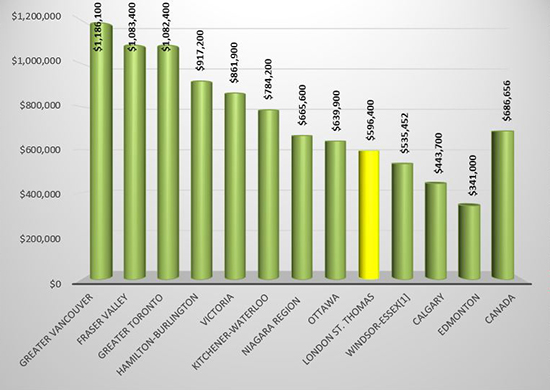
Despite increases to the HPI benchmark price and average sales price, homes in LSTAR's jurisdiction continue to remain relatively affordable when compared to houses from some other major Ontario and Canadian centres. The following chart is based on data taken from the CREA National Price Map for September 2021.
According to a research report2, a total of $73,250 in ancillary expenditures is generated by the average housing transaction in Ontario over a period of three years from the date of purchase. "That translates into potentially more than $63 million being generated into the economy across the region through 2024," Lane said. "It shows how critical the business of real estate is to putting the economy back on track to recovery."
[2]Economic Impacts of MLS® Systems Home Sales and Purchases in Canada and the Provinces, Altus Group, 2019

