The London and St Thomas Association of REALTORS® (LSTAR) announced 1,231 homes exchanged hands last month, the highest number of home sales recorded via the MLS® system for the month of April since the Association began tracking data in 1978.
"We are encouraged by the strong sales numbers, as the spring market ramps up," said LSTAR 2021 President Jack Lane. "Year-to-date sales are also performing ahead of 2020. At the end of April, there have been 3,918 sales, up more than 57% over the same period last year."
LSTAR’s regions, like many others across the province, are experiencing some of the lowest inventory levels seen in the past 10 years. Combined with a high demand, these dynamics have contributed to a very robust marketplace, with numerous situations of multiple offers and properties being sold for considerably more than their listing prices.
"It's important for the public to understand that every transaction is different, based on housing type, housing features, geographical location and many other factors," Lane said. "Each transaction is unique and does not necessarily represent activity across the entire marketplace."
The following table shows last month's MLS® Home Price Index (HPI) benchmark prices by area and how they compare to the average sales prices. The HPI benchmark price reflects the value of a "typical home" as assigned by buyers in a certain area based on various housing attributes, while the average sales price is calculated by adding all the sale prices for homes sold and dividing that total by the number of homes sold. Since averages may be affected by the monthly changes in the mix of sales activity, the HPI benchmark price is a more accurate way to gauge price trends over time.
|
Area |
April 2021 MLS® HPI Benchmark Price |
April 2021 Average Price |
|---|---|---|
| Elgin | $595,200 | $641,366 |
| London East | $505,700 | $508,158 |
| London North | $696,700 | $755,102 |
| London South | $570,200 | $650,472 |
| Middlesex | $859,700 | $881,011 |
| St. Thomas | $490,900 | $541,255 |
| Strathroy | $691,700 | $633,280 |
| LSTAR | $583,400 | $643,835 |
"The pandemic has added another layer to managing the home selling and buying process," Lane said. "We understand the challenges many potential home buyers are going through right now. A local REALTOR® is always going to be your best resource to help you navigate through this marketplace."
The single-family home maintains its place as the most popular housing type sold, with 913 sales in April. The table below shows the April benchmark prices for all housing types and how they stack up against the values from a year ago.
|
MLS® Home Price Index Benchmark Prices |
||
|---|---|---|
|
Benchmark Type |
April 2021 |
Change over April 2020 |
| LSTAR Composite | $583,400 | ↑ 42% |
| LSTAR Single-Family | $640,300 | ↑ 47.3% |
| LSTAR One Storey | $586,300 | ↑ 46.9% |
| LSTAR Two Storey | $701,600 | ↑ 47.5% |
| LSTAR Townhouse | $444,500 | ↑ 32.1% |
| LSTAR Apartment | $295,400 | ↑ 6.9% |
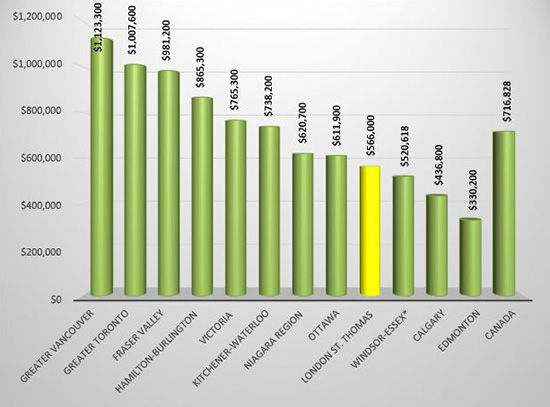
Despite increases to the HPI benchmark price and average sales price, homes in LSTAR's jurisdiction continue to remain relatively affordable when compared to houses from some other major Ontario and Canadian centres. The following table is based on data taken from the CREA National Price Map for March 2021.
According to a research report[1], a total of $73,250 in ancillary expenditures is generated by the average housing transaction in Ontario over a period of three years from the date of purchase.
"Over the next few years, the home sales in April could potentially generate more than $90 million back into the local economy," Lane said.
[1]Economic Impacts of MLS® Systems Home Sales and Purchases in Canada and the Provinces, Altus Group, 2019.

