LSTAR's residential sales activity hit a new record in October, with 928 homes1 exchanging hands in the Association's jurisdiction. This brings the total number of 2019 LSTAR home sales to 8,909, 3.4% higher than the October 2018 year-to-date figures.
"Once again, home sales soared to new heights, making last month the best October since 1978, when the Association began tracking sales," said Earl Taylor, 2019 LSTAR President. "In addition, the year-to-date data suggests this year's home sales are poised to surpass last year's."
The number of active listings saw a slight year-over-year uptick in October – from 1,596 in 2018 to 1,716 in 2019, but stayed well below the 10-year average. The sales to new listings ratio for the entire Association’s jurisdiction sat at 79.5% last month, 2.4% higher than in October 2018. "This speaks to the brisk pace of the local real estate market, which clearly favours Sellers," Taylor added.
Overall, the average home price was $412,883. This represents an 8.7% increase over October 2018, but is slightly lower than the August average home price of $413,000.
|
Area |
October Average Sale Price |
|---|---|
| Elgin County | $394,119 |
| London | $416,592 |
| Middlesex County | $482,569 |
| St. Thomas | $349,895 |
| Strathroy | $438,019 |
| LSTAR | $412,883 |
Looking at London's three main geographic areas, the average home price in London East was $340,530, up 8.9% from last October. In London South (which includes data from the west side of the city), the average home sales price was $425,631, up 7.4% compared to the previous year, while London North saw an increase of 2.2% over last October, with an average home sales price of $486,584.
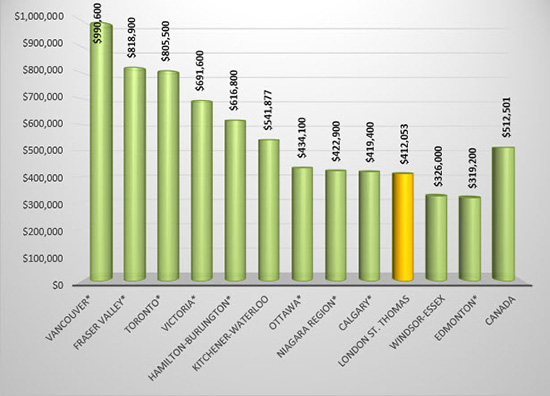
The following chart is based on data taken from the Canadian Real Estate Association (CREA) National Price Map for September 2019 (the latest CREA statistics available). It provides a snapshot of how home prices in London and St. Thomas compare to some other major Ontario and Canadian centres.
According to a research report2, a total of $67,425 in ancillary expenditures is generated by the average housing transaction in Ontario over a period of three years from the date of purchase. "This means that LSTAR's October home resales would translate into more than $62 million back into the local economy for the period 2018 - 2021," Taylor concluded.
The London and St. Thomas Association of REALTORS® (LSTAR) exists to provide its REALTOR® Members with the support and tools they need to succeed in their profession. LSTAR is one of Canada’s 15 largest real estate associations, representing over 1,700 REALTORS® working in Middlesex and Elgin Counties, a trading area of 500,000 residents. LSTAR adheres to a Quality of Life philosophy, supporting growth that fosters economic vitality, provides housing opportunities, respects the environment and builds good communities and safe neighbourhoods and is a proud participant in the REALTORS Care Foundation’s Every REALTOR™ Campaign.
*Areas displaying MLS® Home Price Index benchmark prices; all other areas display average prices
1 These statistics are prepared for LSTAR by the Canadian Real Estate Association (CREA) and represent a data snapshot taken on November 1st, 2019, based on processed home sales activity between October 1st and 31st, 2019.
2 Economic Impacts of MLS® Systems Home Sales and Purchases in Canada and the Provinces, Altus Group Economic Consulting, 2017.

