London and St Thomas Association of REALTORS® (LSTAR) announced 1,000 homes* were sold in July, down 1.8% over the same time last year. July 2018 marked the third best July for home resales since the Association began tracking sales data in 1978.
"The numbers tell us we’re experiencing a very healthy summer for home resales," said Jeff Nethercott, 2018 LSTAR President. "This is the third consecutive month of at least 1,000 homes being sold and the resale activity remains above the 10-year average. Inventory remains at a 10-year low, while we continue to see an increase in average sales price."
By geographic area, London East continues to make the largest gains, with the average July sales price at $288,648 up 14.3% from July 2017 and up 40.2% compared to July 2015. The average sales price in London North was $441,035 up 8.0% from July 2017 and up 35.9% compared to July 2015. Meanwhile, the average sales price in London South was $370,399, up 10.9 percent from July 2017 and up 32.2% from July 2015.
Overall, the average July sales price across London and St. Thomas was $360,068 up 10.3% from July 2017 and up 34.2% from July 2015. Going back further, it’s a 68.2% increase compared to the average sales price 10 years ago.
“One of the biggest trends in 2018 is the lack of inventory,” Nethercott said. “In July, there were 1,721 active listings, down 10.9% from this time last year and down 55% from July 2015. The sales-to-new listings ratio was 78.9%, which the Canadian Real Estate Association (CREA) says represents conditions in the marketplace that favour sellers (a ratio between 40% and 60% is generally consistent with a balanced market). In London East, the sales-to-new listings ratio was 89.1%, while in London South it was 81%.”
St. Thomas saw a total of 79 homes sold in July, down 7.1% from the same period last year. For inventory, there were 87 active listings, down 22.3% from last July and down 67% from July 2015. The average home sales price in St. Thomas was $303,988 up 15.9% from July 2017 and up 35.5% from July 2015.
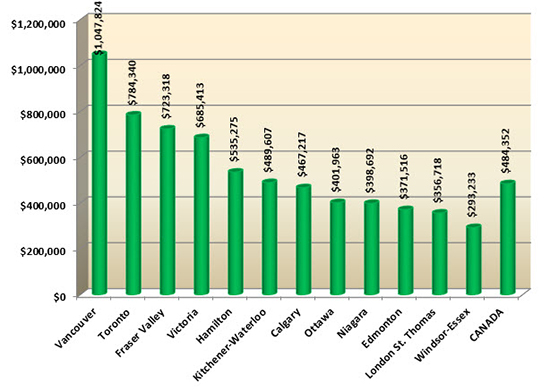
The following chart is based on data taken from the CREA National MLS® Report for June 2018 (the latest CREA statistics available). It provides a snapshot of how average home prices in London and St. Thomas compare to other major Ontario and Canadian centres.
According to a research report1, one job is created for every three real estate transactions and approximately $53,000 in ancillary spending is generated each time a home changes hands in Ontario. “The business of real estate affects all of us, with huge impact to the local economy, generating potentially more than $53 million in July,” Nethercott said. “The home resales have helped create approximately 333 jobs, making a significant contribution to the well-being and quality of life for the communities of London and St. Thomas.”
The London and St. Thomas Association of REALTORS® (LSTAR) exists to provide its REALTOR® Members with the support and tools they need to succeed in their profession. LSTAR is one of Canada’s 15 largest real estate associations, representing over 1,700 REALTORS® working in Middlesex and Elgin Counties, a trading area of 500,000 residents. LSTAR adheres to a Quality of Life philosophy, supporting growth that fosters economic vitality, provides housing opportunities, respects the environment and builds good communities and safe neighbourhoods and is a proud participant in the REALTORS Care Foundation’s Every REALTOR™ Campaign.
*These statistics are prepared for LSTAR by the Canadian Real Estate Association (CREA) and represent a data snapshot taken on August 1, 2018, based on processed home sales activity between July 1 and 31, 2018.
1 Economic Impacts of MLS® System Home Sales and Purchases in Canada and the Provinces, Altus Group Consulting, 2013.

