The local housing market continued to cool off in July, with 514 homes exchanging hands via the MLS® System of the London and St. Thomas Association of REALTORS® (LSTAR). The housing supply made a steady gain from 2.8 months of inventory in June to 3.6 months of inventory in July, signaling movement toward a more balanced market.
"With rising interest rates, July saw home sales activity continue to slow down," said Randy Pawlowski, 2022 LSTAR President. "Inventory has increased, showing more signs of a balanced market. The 3.6 months of inventory in July is in line with the months of inventory recorded during the same month in 2014 and 2015."
While LSTAR's composite MLS® Home Price Index Benchmark Price of $624,400 was down 3.7% from June, this value is still 6.4% higher than the figure recorded for July 2021. Similarly, LSTAR's overall average home price fell slightly from $686,287 in June to $667,323 in July. Compared to the same period last year, this figure is still 7.1% higher. This represents a trend the majority of local markets are experiencing across the country, according to CREA.
"It's also important to note that every home transaction is unique and does not represent activity across the entire marketplace," Pawlowski said. "When markets fluctuate, your local REALTOR® can help you navigate through the changing environment, with professional guidance and real-time data whether you're looking to buy or sell."
The following table shows how July's average home sales prices in LSTAR's main regions compared to the benchmark prices for the same areas.
|
Area |
July 2022 MLS® HPI Benchmark Price |
July 2022 Average Price |
|---|---|---|
| Central Elgin | $627,700 | $629,313 |
| London East | $511,900 | $559,189 |
| London North | $747,900 | $764,082 |
| London South | $620,700 | $669,723 |
| Middlesex Centre | $876,300 | $1,047,045 |
| St. Thomas | $531,900 | $560,360 |
| Strathroy-Caradoc | $740,000 | $637,838 |
| LSTAR | $624,400 | $667,323 |
“The single-family home remains the most popular housing style, with 384 units sold," Pawlowski said. "Apartment sales saw the largest gain in average price, at $454,421, up 19.6% compared to the same time a year ago."
The following table shows the July benchmark prices for all housing types in LSTAR's jurisdiction and how they stack up against the values from the previous year.
|
MLS® Home Price Index Benchmark Prices |
||
|---|---|---|
|
Benchmark Type |
July 2022 |
Change over July 2021 |
| LSTAR Composite | $624,400 | ↑ 6.4% |
| LSTAR Single-Family | $662,300 | ↑ 4.8% |
| LSTAR One Storey | $590,600 | ↑ 5.3% |
| LSTAR Two Storey | $711,400 | ↑ 4.6% |
| LSTAR Townhouse | $541,200 | ↑ 10.5% |
| LSTAR Apartment | $442,500 | ↑ 21.7% |
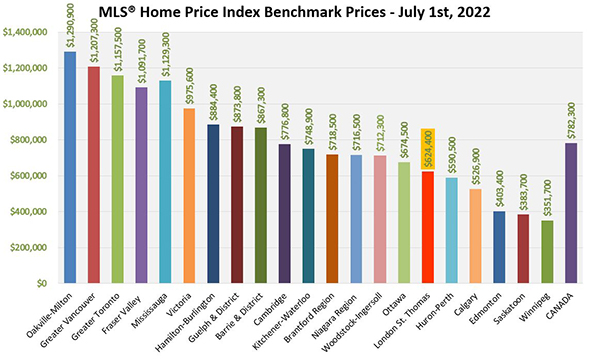
“When compared to other cities in Ontario and across Canada, homes in our area continue to remain relatively affordable," Pawlowski said. The following chart shows HPI benchmark prices for July, courtesy of the Canadian Real Estate Association (CREA).
According to a research report by Altus Group, a total of $73,250 in ancillary expenditures is generated by the average housing transaction in Ontario over a period of three years from the date of purchase. "This means over the next few years, the sales in July could potentially generate more than $37 million in spin-off spending to our local economy," Pawlowski said.
This information is provided by the London and St. Thomas Association of REALTORS®. The information herein is believed to be accurate and timely, but no warranty as such is expressed or implied.

