London and St Thomas Association of REALTORS® (LSTAR) announced 1,146 homes exchanged hands last month in its jurisdiction, 1% less than in May 2018 and 26% down from May 2017, which was a record-setting month – with 1,549 homes sold. The number of active listings for the same area sat at 1,855 in May, with most LSTAR regions seeing year-over-year increases, with the exception of London East and St. Thomas, where this number decreased.
"Some of the May figures show signs of market stabilization, with London North, Elgin County and Middlesex County entering a more balanced territory," said Earl Taylor, 2019 LSTAR President. "This is not the case of St. Thomas, which is still very much a Sellers' Market. In fact, last month, the sales-to-new listings ratio was higher in St. Thomas than in London – 78.9% versus 69.6% – which means that the existing market conditions in the Railway City clearly favour home sellers," he added. "Moreover, the inventory continues to be very low in St. Thomas, while the average home sale price sits at an all-time high of $363,947," Taylor said.
According to reports by the Canadian Real Estate Association (CREA), last month, in London, the median number of days spent on market by the London residential properties was eight. In Elgin County, the median number of days on market was 22, in Middlesex County – 15, while in St. Thomas and Strathroy was 13. "This proves how dynamic the London real estate market is in comparison with its neighbouring regions," Taylor emphasized.
Overall, the average home price in the Association’s jurisdiction was $414,878. This represents a slight decrease from April 2019, but it's 13.3% up over May 2018.
|
Area |
May Average Sale Price |
|---|---|
| Elgin County | $345,783 |
| London | $423,470 |
| Middlesex County | $487,421 |
| St. Thomas | $363,947 |
| Strathroy | $364,580 |
| LSTAR | $414,878 |
By geographic area, the average price in London East was $337,443 – up 15.6% from last May. In London North, the average home sales price was $492,089 – up 9% compared to the previous year, while in London South, it was $434,017 – an increase of 17.2% from May 2018. In St. Thomas, it was $363,947 – up 25.5% over last May.
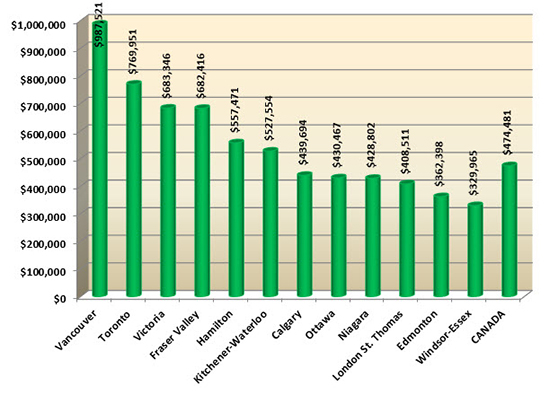
The following chart is based on data taken from the CREA National MLS® Report for April 2019 (the latest CREA statistics available). It provides a snapshot of how average home prices in London and St. Thomas compare to other major Ontario and Canadian centres.
According to a research report[1], a total of $67,425 in ancillary expenditures is generated by the average housing transaction in Ontario over a period of three years from the date of purchase. “Based on the home resales in May, that’s generating potentially more than $77 million back into the local economy for the next few years,” Taylor concluded.
The London and St. Thomas Association of REALTORS® (LSTAR) exists to provide its REALTOR® Members with the support and tools they need to succeed in their profession. LSTAR is one of Canada’s 15 largest real estate associations, representing over 1,700 REALTORS® working in Middlesex and Elgin Counties, a trading area of 500,000 residents. LSTAR adheres to a Quality of Life philosophy, supporting growth that fosters economic vitality, provides housing opportunities, respects the environment and builds good communities and safe neighbourhoods and is a proud participant in the REALTORS Care Foundation’s Every REALTOR™ Campaign.
*These statistics are prepared for LSTAR by the Canadian Real Estate Association (CREA) and represent a data snapshot taken on June 1, 2019, based on processed home sales activity between May 1 and 31, 2019.
[1] Economic Impacts of MLS® Systems Home Sales and Purchases in Canada and the Provinces, Altus Group Economic Consulting, 2017.

