The London and St Thomas Association of REALTORS® (LSTAR) announced 931 homes exchanged hands in August, making it the 2nd best August for sales since the Association began tracking data in 1978.
"August capped off a very strong summer for home sales in the region," said 2020 LSTAR President Blair Campbell. "For the first time, the average home sales price was over $500,000. It's a testament to the pent-up demand caused during the COVID-19 lockdown months."
The average home sales price was $501,584 in August, up 22% over August 2019 and up more than 55% compared to the same time just three years ago.
"It's important to note the average sales price encompasses all housing types across the entire LSTAR jurisdiction, from single detached homes to high-rise apartment condominiums," Campbell said. "When you look at the five major areas, each one saw healthy gains."
The following table illustrates last month's average home prices by area and how they compare to the values recorded at the end of August 2019.
|
Area |
August 2020 Average Sale Price |
Change over August 2019 |
|---|---|---|
| Elgin County | $462,551 | ↑ 19.9% |
| London | $501,849 | ↑ 22.4% |
| Middlesex County | $635,077 | ↑ 29.3 % |
| St. Thomas | $455,786 | ↑ 31.3% |
| Strathroy | $506,479 | ↑ 9.0% |
| LSTAR | $501,584 | ↑ 22.0% |
Taking a closer look at the region's geography, London South (which also includes data from the west side of London) continues to show robust activity in the marketplace.
"Within the London area, London South had the biggest gains in sales activity and average sales price," Campbell said. "There were 296 sales, up more than 27% compared to a year ago and the average sales price jumped to $522,999, up 27.4% over August 2019. That's also up 60% compared to three years ago and up more than 105% over August 2015."
The average sales price in St. Thomas reached a new peak of $455,786, an increase of 31.3% over last year, and up more than 77% compared to August 2017.
The median number of days that a home was on the market in St. Thomas was nine; that's down from 11 days in August 2019. Meanwhile in Strathroy, it was 9.5, down from 21; in Elgin it was 17, down from 27; in London it was 10, down from 12.5; and in Middlesex it was 13, up from 11.5.
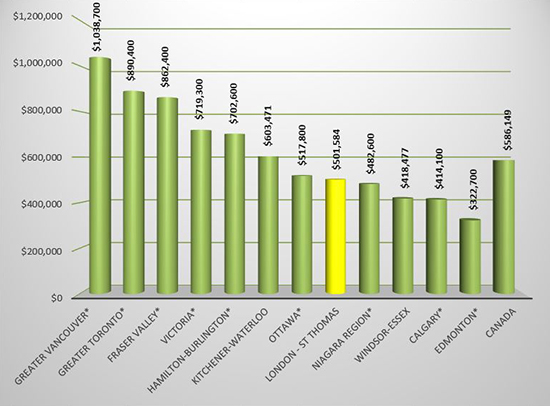
The following chart is based on data taken from the CREA National Price Map for August 2020. It provides a snapshot of how home prices in London and St. Thomas compare to some other major Ontario and Canadian centres.
According to a research report[1], a total of $67,425 in ancillary expenditures is generated by the average housing transaction in Ontario over a period of three years from the date of purchase.
"This means that our August home sales could translate into more than $62 million going back into the local economy within the next few years," Campbell said. "The business of real estate is key to driving the economy and will be critical to the recovery efforts as we get through the COVID-19 pandemic."
The London and St. Thomas Association of REALTORS® (LSTAR) exists to provide its REALTOR® Members with the support and tools they need to succeed in their profession. LSTAR is one of Canada’s 10 largest real estate associations, representing over 1,900 REALTORS® working in Middlesex and Elgin Counties, a trading area of 500,000 residents. LSTAR adheres to a Quality of Life philosophy, supporting growth that fosters economic vitality, provides housing opportunities, respects the environment and builds good communities and safe neighbourhoods and is a proud participant in the REALTORS Care Foundation’s Every REALTOR™ Campaign.
*Areas displaying MLS® Home Price Index benchmark prices; all other areas display average prices.
[1] Economic Impacts of MLS® Systems Home Sales and Purchases in Canada and the Provinces, Altus Group Economic Consulting, 2017.

