The London and St Thomas Association of REALTORS® (LSTAR) announced 1,194 homes exchanged hands last month, the highest number of home sales recorded via the MLS® system for the month of June since the Association began tracking data in 1978.
"We're halfway through the year and the housing marketplace continues to be very strong," said LSTAR 2021 President Jack Lane. "We're encouraged by year-to-date sales, which are performing ahead of 2020. At the end of June, there have been 6,378 sales, up 49.4% over the same period last year."
The average sales price across the LSTAR region in June was $641,072, an increase of more than 35% compared to June 2020.
"The average sales price was on par with what has been recorded over the past four months," Lane said. "We haven't experienced the monthly spikes observed during the second half of 2020. This signals the marketplace is beginning to stabilize, in line with the moderating trend seen throughout the country. With all these changes, your local REALTOR® remains the best resource of information and guidance about buying or selling a home."
The following table illustrates how last month's average sales prices compare to the benchmark prices. The MLS® Home Price Index (HPI) benchmark price reflects the value of a "typical home" from a certain area as assigned by local home buyers based on various housing attributes. The average sales price is calculated by adding the sale prices for all the homes sold and dividing that total by the number of transactions. Since monthly averages may be skewed by the type of houses sold in that timeframe, the HPI benchmark price is a more accurate way to gauge price trends.
|
Area |
June 2021 MLS® HPI Benchmark Price |
June 2021 Average Price |
|---|---|---|
| Elgin | $609,300 | $651,072 |
| London East | $493,200 | $498,690 |
| London North | $681,500 | $729,338 |
| London South | $563,600 | $629,169 |
| Middlesex | $871,100 | $859,300 |
| St. Thomas | $496,000 | $531,230 |
| Strathroy | $678,200 | $639,946 |
| LSTAR | $574,400 | $641,072 |
The single-family home remains on top of the local buyers' preferences, with 892 sales in June. The table below shows the June benchmark prices for all housing types and how they stack up against the values from a year ago.
|
MLS® Home Price Index Benchmark Prices |
||
|---|---|---|
|
Benchmark Type |
June 2021 |
Change over June 2020 |
| LSTAR Composite | $574,400 | ↑ 37.6% |
| LSTAR Single-Family | $628,600 | ↑ 41.1% |
| LSTAR One Storey | $589,000 | ↑ 45.4 % |
| LSTAR Two Storey | $668,700 | ↑ 37.7% |
| LSTAR Townhouse | $465,500 | ↑ 41.1% |
| LSTAR Apartment | $278,900 | ↑ 2.0 % |
"It's important to understand each housing transaction is unique and does not necessarily reflect activity across the entire marketplace," Lane said. "For those interested in buying or selling a home, every transaction is different, based on housing type, features, geographical location, and many other factors."
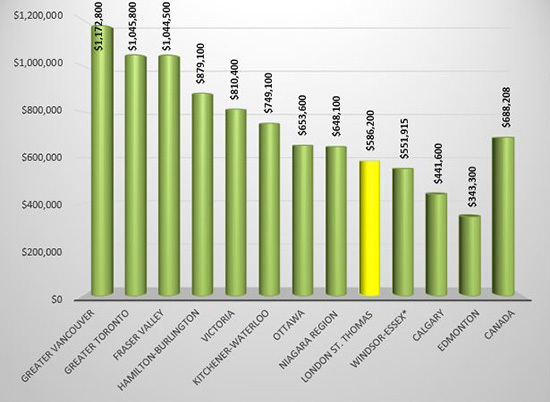
Despite all the increases seen in the HPI benchmark prices and average sales prices, homes in LSTAR's jurisdiction appear to be relatively affordable when compared to houses from some other major Ontario and Canadian centres. The following chart is based on data taken from the CREA National Price Map for May 2021.
According to a research report[1], a total of $73,250 in ancillary expenditures is generated by the average housing transaction in Ontario over a period of three years from the date of purchase. "This means that our June home sales could potentially generate more than $87 million back into the local economy within the next few years," Lane said.
[1]Economic Impacts of MLS® Systems Home Sales and Purchases in Canada and the Provinces, Altus Group, 2019.

