May 2021 was yet another remarkable month for home sales activity in LSTAR's jurisdiction: the Association recorded 1,258 residential transactions via its MLS® systems - up 87.5% from May 2020, when the local real estate market was experiencing a pandemic-induced decline.
"This number marks the second best May for LSTAR home sales, surpassed only by May 2017, when LSTAR REALTORS® sold 1,433 homes," said LSTAR 2021 President Jack Lane. "However, year-to-date sales are at an all-time high. At the end of May, there have been 5,175 sales, up 64.3% over the same period last year."
The overall inventory figure, which shows how long it would take to liquidate the existing housing supply in our area at the current rate of sales activity, remained at 0.6 months - its lowest level in the last decade.
"Combined with the high demand, the lack of housing supply is pushing the Sales to New Listings ratio up, creating a Sellers' Market with multiple offers for many listings and numerous properties sold over the asking price," Lane added. "Nonetheless, it's essential for consumers to understand that each home is unique and its sale price can vary based on its location, type, and features," he emphasized.
The following table illustrates how last month's benchmark prices compare to the average sales prices. The MLS® Home Price Index (HPI) benchmark price reflects the value of a "typical home" from a certain area as assigned by local home buyers based on various housing attributes. The average sales price is calculated by adding the sale prices for all the homes sold and dividing that total by the number of transactions. Since monthly averages may be skewed by the type of houses sold in that timeframe, the HPI benchmark price is a more accurate way to gauge price trends.
|
Area |
May 2021 MLS® HPI Benchmark Price |
May 2021 Average Price |
|---|---|---|
| Elgin | $621,400 | $646,427 |
| London East | $506,900 | $502,608 |
| London North | $691,700 | $741,983 |
| London South | $577,100 | $655,662 |
| Middlesex | $856,800 | $808,936 |
| St. Thomas | $507,000 | $547,777 |
| Strathroy | $681,300 | $636,491 |
| LSTAR | $586,200 | $636,053 |
The single-family home remains on top of the local buyers' preferences, with 937 sales in May. The table below shows the May benchmark prices for all housing types and how they stack up against the values from a year ago.
|
MLS® Home Price Index Benchmark Prices |
||
|---|---|---|
|
Benchmark Type |
May 2021 |
Change over May 2020 |
| LSTAR Composite | $586,200 | ↑ 42.5% |
| LSTAR Single-Family | $637,700 | ↑ 46.2% |
| LSTAR One Storey | $598,100 | ↑ 49.5 % |
| LSTAR Two Storey | $678,300 | ↑ 43.7% |
| LSTAR Townhouse | $484,900 | ↑ 32.1% |
| LSTAR Apartment | $248,300 | ↓ 8.8 % |
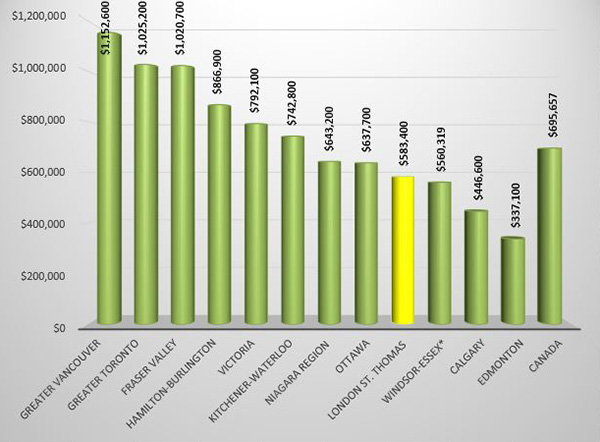
Despite all the increases seen in the HPI benchmark prices and average sales prices, homes in LSTAR's jurisdiction appear to be relatively affordable when compared to houses from some other major Ontario and Canadian centres. The following table is based on data taken from the CREA National Price Map for April 2021.
According to a research report[1], a total of $73,250 in ancillary expenditures is generated by the average housing transaction in Ontario over a period of three years from the date of purchase. "This means that our May home sales could bring more than $90 million back into the local economy within the next few years," Lane said.
"The pandemic and the newly introduced mortgage stress test have made the home buying and selling processes complicated. In these conditions, if you're either a buyer or a seller, it has become more important than ever to have a REALTOR® in your corner," Lane concluded.
[1]Economic Impacts of MLS® Systems Home Sales and Purchases in Canada and the Provinces, Altus Group, 2019.

