The London and St Thomas Association of REALTORS® (LSTAR) announced September achieved a record for residential sales, with 960 homes exchanging hands, up 25% compared to the same time a year ago. This represents the best results ever for September since the Association began tracking data in 1978.
"The strong momentum experienced during the summer months continued through September," said 2020 LSTAR President Blair Campbell. "Similar to many other housing markets across Canada, many are still playing catch up from the COVID-19 lockdown we had during the spring."
The average home sales price across the region also reached a new peak of $521,883, up 28% over September 2019 and up more than 98% compared to the same time five years ago.
"Each of the five major areas in LSTAR's jurisdiction posted gains, led by Middlesex with average sales price of $575,785,"Campbell said. "Again, it's important to note this figure encompasses all housing types, from a 2-storey single detached home to a high-rise apartment condominium."
The following table shows last month's average home prices by area and how they compare to the values recorded at the end of September 2019.
|
Area |
September 2020 Average Sale Price |
Change over September 2019 |
|---|---|---|
| Elgin County | $498,098 | ↑ 17.6% |
| London | $527,414 | ↑ 30.1% |
| Middlesex County | $575,785 | ↑ 18.1% |
| St. Thomas | $433,504 | ↑ 26.7% |
| Strathroy | $526,614 | ↑ 14.0% |
| LSTAR | $521,883 | ↑ 28.0% |
Taking a closer look at the region's geography, London North achieved a new peak in average sales price, at $613,755, up 28.3% compared to the same time a year ago. It's the first time the average sales price in London North has surpassed $600,000.
"London South (which also includes data from the west side of London) had the largest sales activity," Campbell said. "There were 263 sales, up more than 28% compared to September 2019. Meanwhile, the average sales price jumped to $535,566, up 33.6% over a year ago. That's also up 99% compared to five years ago."
The average sales price in St. Thomas was $433,504, an increase of 26.7% over last year, and up more than 102% compared to September 2015.
The median number of days that a home was on the market in St. Thomas was eight, that's down from 11.5 days in September 2019. Meanwhile, in Strathroy, it was 16.5, up from 12; in Elgin it was 10.5, down from 27; in London it was eight, down from 10; and in Middlesex it was 14, down from 18.
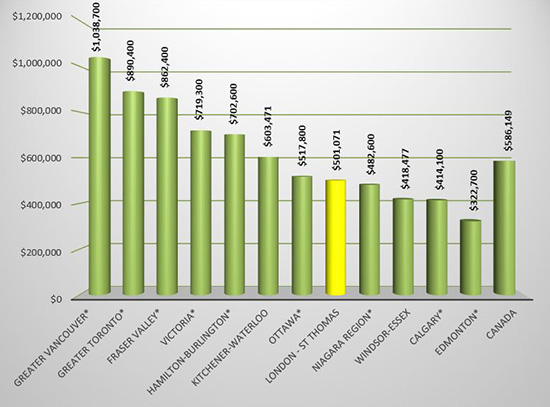
The following chart is based on data taken from the CREA National Price Map for August 2020. It provides a snapshot of how home prices in London and St. Thomas compare to some other major Ontario and Canadian centres.
According to a research report[1], a total of $67,425 in ancillary expenditures is generated by the average housing transaction in Ontario over a period of three years from the date of purchase.
"The record sales for September translates into more than $64 million going back into the local economy within the next few years," Campbell said. "As we all manage through the COVID-19 pandemic, real estate is the locomotive that can put Ontario's economy on the track to recovery."
The London and St. Thomas Association of REALTORS® (LSTAR) exists to provide its REALTOR® Members with the support and tools they need to succeed in their profession. LSTAR is one of Canada’s 10 largest real estate associations, representing over 1,900 REALTORS® working in Middlesex and Elgin Counties, a trading area of 500,000 residents. LSTAR adheres to a Quality of Life philosophy, supporting growth that fosters economic vitality, provides housing opportunities, respects the environment and builds good communities and safe neighbourhoods and is a proud participant in the REALTORS Care Foundation’s Every REALTOR™ Campaign.
*Areas displaying MLS® Home Price Index benchmark prices; all other areas display average prices.
[1] Economic Impacts of MLS® Systems Home Sales and Purchases in Canada and the Provinces, Altus Group Economic Consulting, 2017.

