London and St. Thomas Association of REALTORS® (LSTAR) announced that 866 homes exchanged hands in March, an increase of 6.9% compared to March 2019. Units sold are on par with the 10-year average.
"For the first quarter, home sales in 2020 are at 2,170, 12.3% ahead of 2019,” said 2020 LSTAR President Blair Campbell. “But with the COVID-19 pandemic affecting all businesses, there is an expectation the marketplace will be impacted in the coming weeks and months. We’ll have to wait and see what this means for LSTAR’s jurisdiction, based on data for the upcoming monthly cycles."
"First I want to stress that LSTAR's highest priority during this challenging time is the safety and well-being of its Members and staff," Campbell said. "We continue to urge members to practice social distancing and follow the guidelines set by our public health authorities. It is not business as usual."
Compared to a year ago, the overall average home price experienced an increase of 10.3%, rising to $447,152 in March. This average sales price includes all housing types, from single detached homes to high rise apartment condominiums. Across the five major areas of LSTAR's region, average home sales price continued to increase. The following table illustrates last month's average home prices by area and how they compare to the values recorded at the end of March 2019.
|
Area |
March 2020 Average Sale Price |
Change over March 2019 |
|---|---|---|
| Elgin County | $409,048 | ↑ 11.7% |
| London | $455,438 | ↑ 9.5% |
| Middlesex County | $571,715 | ↑ 21.1% |
| St. Thomas | $392,196 | ↑ 8.5% |
| Strathroy | $414,530 | ↑ 7.2% |
| LSTAR | $447,152 | ↑ 10.3% |
"Looking at average prices in London’s three main geographic areas, London East saw the biggest gain compared to March 2019," Campbell said.
The average home price in London East was $393,661, up 20.8% from the same time last year, while London North increased 1.4% over to $527,231. In London South (which contains data from the west), the average home price was $458,666, up 13.8% over March 2019. St. Thomas saw an average price of $392,196, an increase of 8.5% from last March.
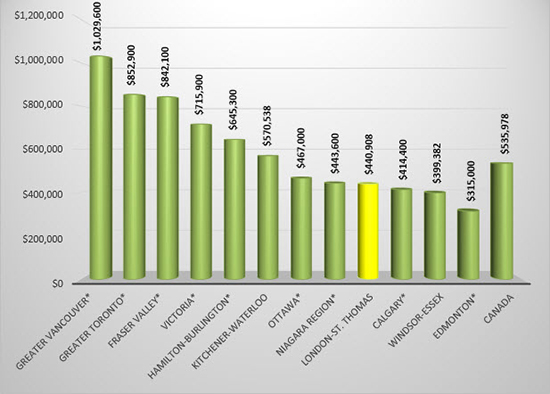
The following chart is based on data taken from the CREA National Price Map for February 2020 (the latest CREA statistics available). It provides a snapshot of how home prices in London and St. Thomas compare to some other major Ontario and Canadian centres.
According to a research report[1], a total of $67,425 in ancillary expenditures is generated by the average housing transaction in Ontario over a period of three years from the date of purchase.
"This means that our March home sales would bring more than $58 million back into the local economy throughout the next few years," Campbell said. “The business of real estate affects many facets of the economy, so we’ll be monitoring the impacts of the COVID-19 pandemic."
The London and St. Thomas Association of REALTORS® (LSTAR) exists to provide its REALTOR® Members with the support and tools they need to succeed in their profession. LSTAR is one of Canada’s 10 largest real estate associations, representing over 1,900 REALTORS® working in Middlesex and Elgin Counties, a trading area of 500,000 residents. LSTAR adheres to a Quality of Life philosophy, supporting growth that fosters economic vitality, provides housing opportunities, respects the environment and builds good communities and safe neighbourhoods and is a proud participant in the REALTORS Care Foundation's Every REALTOR™ Campaign.
*Areas displaying MLS® Home Price Index benchmark prices; all other areas display average prices
[1] Economic Impacts of MLS® Systems Home Sales and Purchases in Canada and the Provinces, Altus Group Economic Consulting, 2017.

