The London and St. Thomas Association of REALTORS® announced that 668 homes exchanged hands last month in its jurisdiction, down 41.6% from May 2019 and 26.3% less than in May 2010. The number of LSTAR’s listings was 973 in May, which represents a 42.3% decrease from a year ago and 41.5% from ten years ago.
"Even though the total number of residential transactions remained well below the 10-year average, in May, we saw notable month-over-month increases: 42.4% in home sales and 31.8% in listings, which we find very encouraging," said Blair Campbell, 2020 LSTAR President. "In addition, when looking at the year-over-year percentage changes, one can notice that the decrease in home sales is directly proportional to the one in listings, which means that the ratio between supply and demand is almost unchanged," he added.
"Despite the new social distancing rules, the open house prohibition and the lay-offs caused by COVID-19, the local real estate market succeeded in staying in Sellers' territory, which speaks to the strength of its fundamentals," Campbell emphasized.
The overall average home price saw an increase of 7.4% over a year ago, rising to $445,732 in May. This average sales price includes all housing types - from single detached homes to high-rise apartment condominiums. All the five major areas of LSTAR's region witnessed increases in their average home sales price. The following table illustrates last month's average home prices by area and how they compare to the values recorded at the end of May 2019.
|
Area |
May 2020 Average Sale Price |
Change over May 2019 |
|---|---|---|
| Elgin County | $396,754 | ↑ 14.7% |
| London | $450,114 | ↑ 6.2% |
| Middlesex County | $550,902 | ↑ 13.0 % |
| St. Thomas | $370,182 | ↑ 1.7% |
| Strathroy | $425,749 | ↑ 16.8% |
| LSTAR | $445,732 | ↑ 7.4% |
"Looking at London's three main geographic areas, London South saw the highest number of home sales last month, while London East saw the biggest price gain compared to May 2019," Campbell said.
The average home price in London East was $365,261, up 8.4% from the same time last year, while in London North increased 7.7% over the same period to $531,626. In London South, which also includes data from the west of the City, the average home price was $462,334, up 6.5% over May 2019. St. Thomas saw an average price of $370,182, an increase of 1.7% from last May.
According to a report by the Canadian Real Estate Association, last month, in London, the median number of days that a home was on the market was 14 - up from 9 days in May 2019. As compared to a year ago, in Elgin County, the median number of days spent by a home on the market was 17 – down from 26; in Middlesex County it was 22 – up from 17; in Strathroy was 19, up from 14; and in St. Thomas it was 12 days – exactly the same as in May 2019.
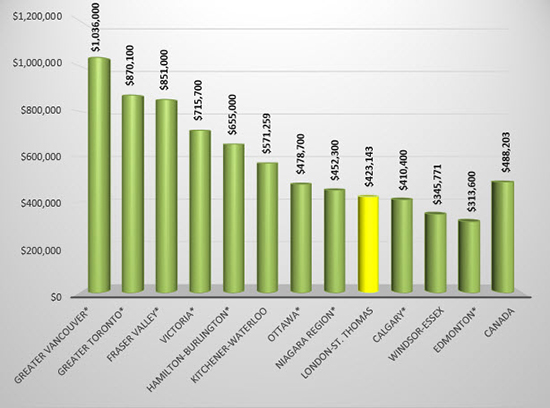
The following chart is based on data taken from the CREA National Price Map for April 2020 (the latest CREA statistics available). It provides a snapshot of how home prices in London and St. Thomas compare to some other major Ontario and Canadian centres.
According to a research report[1], a total of $67,425 in ancillary expenditures is generated by the average housing transaction in Ontario over a period of three years from the date of purchase.
This means that our May home sales are potentially bringing over $45 million back into the local economy within the next few years," Campbell said. "The real estate sector is one of the most important drivers of the Canadian economy. That is why LSTAR is making every effort to provide its Members with the knowledge and tools they need to continue doing their job in these extraordinary circumstances," Campbell concluded.
[1] Economic Impacts of MLS® Systems Home Sales and Purchases in Canada and the Provinces, Altus Group Economic Consulting, 2017.
*Areas displaying MLS® Home Price Index benchmark prices; all other areas display average prices

