The London and St. Thomas Association of REALTORS® (LSTAR) announced 757 homes exchanged hands last month, slightly down 10.2% from the same time a year ago. Year-to-date sales are up 10.6%, with a total of 10,111 homes sold, marking the second consecutive year residential sales have surpassed 10,000 across the region.
The October results mark a new chapter for LSTAR, after launching the CoreLogic Matrix platform as part of the Ontario Collective, a collaborative group of 13 real estate boards and associations across Ontario focused on delivering robust data, tools, and the best available technology to support over 5,000 REALTORS®.
“LSTAR was part of the Collective’s first phase launch of this new enhanced regional MLS® System, supporting our REALTOR® Members to better serve consumers,” said Jim Smith, 2017 LSTAR President. “Along with the launch of Matrix, LSTAR has also upgraded its monthly home statistics reporting, thanks to a collaborative partnership with the Canadian Real Estate Association (CREA).”
The CREA Residential Market Activity Report provides more data, featuring an in-depth look at home sales trends happening across London and St. Thomas.
“LSTAR has been working with CREA over the last few months to develop this report and we are very excited to share the data with our Members and the public,” Smith said. “The CREA report includes more specific residential activity based on geography and more detailed comparison statistics to activity in previous years.”
In October, the average sales price across London and St. Thomas was $325,331 up 14.2% from the same time a year ago. The average year-to-date sales price was $330,497 up 18.3% from October 2016.
“When looking at the region, home sales in London East, London South and London North have posted healthy gains in year-to-date activity,” Smith said. “In London East, home sales are up 21.2% compared to a year ago, while in London South, sales are up 13.9% and in London North, sales are up 6.5% compared to this time last year.”
In October, there were 847 listings, down 17% from the same time in 2016. St. Thomas saw a total of 67 homes sold, down 21.2% from the same time last year. The average home price in St. Thomas was $284,344 up 25.7% from October 2016.
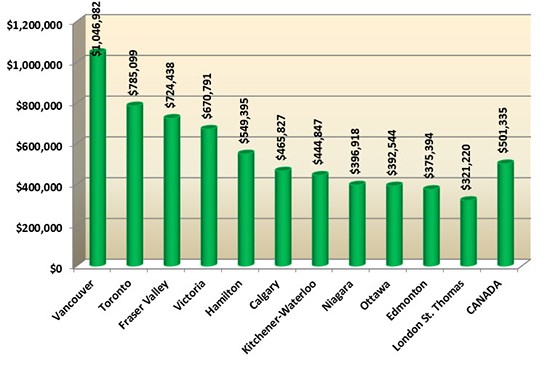
The following chart is based on data taken from the CREA National MLS® Report for September 2017 (the latest CREA statistics available). It provides a snapshot of how average home prices in London and St. Thomas compare to other major Ontario and Canadian centres.
According to a research report1, one job is created for every three real estate transactions and approximately $53,000 in ancillary spending is generated every time a home changes hands in Ontario. “Based on the monthly total for October, that translates into creating approximately 252 jobs and positioning us to potentially generate more than $40 million back into the local economy,” Smith said.
The London and St. Thomas Association of REALTORS® (LSTAR) exists to provide our REALTOR® Members with the support and tools they need to succeed in their profession. LSTAR is one of Canada’s 15 largest real estate associations, representing over 1,700 REALTORS® working in Middlesex and Elgin Counties, a trading area of 500,000 residents. LSTAR adheres to a Quality of Life philosophy, supporting growth that fosters economic vitality, provides housing opportunities, respects the environment and builds good communities and safe neighbourhoods and is a proud participant in the REALTORS Care Foundation’s Every REALTOR™ Campaign.
*These statistics are prepared for LSTAR by the Canadian Real Estate Association (CREA) and represent a data snapshot taken on November 1, 2017, based on reported sales activity between October 1 and 31, 2017.
1 Economic Impacts of MLS® System Home Sales and Purchases in Canada and the Provinces, Altus Group Consulting, 2013.

