A total of 934 homes sold in July, down 4.7% overall from July 2014. "To put these numbers in perspective, July 2014 was the best July since 2007 with 980 sales. That's only 46 more sales than took place last month," says Carl Vandergoot, President of the London and St. Thomas Association of REALTORS®. "Compare this month's sales to those of July 2013 (788), July 2012 (746) and July 2011 (742) and it's clear that July 2015 finished strong." Year-to-Date, sales are up 9.5% over last year.
Listings were down 2.7%, while inventory – active listings end of period – were also down, 3.9%. "These percentages aren't dramatic," says Vandergoot, "but they do point to a tightening supply, making now a smart time to list."
The market in London's Sister City of St. Thomas had not only its best July ever, but also its best MONTH ever. 94 homes exchanged hands in July 2015, up 27%. The average price of a home in St. Thomas Year-to-Date stands at $218,775, up 9.5%.
The best-selling house style in LSTAR's jurisdiction for July 2015 was the two-storey, then the bungalow, followed by ranches, then townhouse condominiums, then high rise apartment condos. As of July 31, the average price for a detached home Year-to-Date stood at $283,593, up 4.8%, while the average price for a condo over the same period stood at $191,169, up 4.6%. Year-to-Date the average price of all homes sold through LSTAR's MLS® stood at $265,902, up 4.6%.
|
House Style |
Units Sold |
Average Price |
|---|---|---|
| 2 storey | 235 | $368,525 |
| Bungalow | 155 | $204,882 |
| Ranch | 117 | $348,051 |
| Townhouse | 76 | $150,105 |
| High rise apt. condo | 42 | $169,922 |
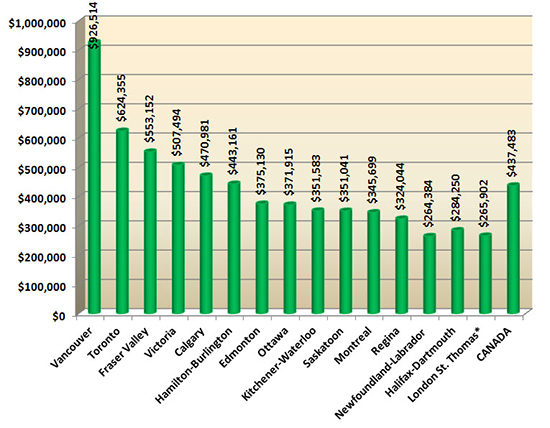
The following chart, based on data taken from CREA's National MLS® Report for June 2015 (the latest information available), demonstrates how homes in LSTAR's jurisdiction continue to maintain their affordability compared to other major Ontario and Canadian centers.
According to recent research conducted by the Altus Group, one job is created for every three real estate transactions and approximately $52,000 in ancillary spending is generated every time a house changes hands in Ontario. "It's clear that real estate drives much of our local economy," says Vandergoot, "which makes July 2015 a good news story."
*Average Price Overall for July 2015

