The London and St. Thomas Association of REALTORS® (LSTAR) announced that 1,050 homes were sold last month in its jurisdiction, 1.3% less units than in June 2018 and 9.6% less than in May 2019. During the same period, there were 1,463 new listings in our area, 0.9% less than a year ago, but the inventory increased slightly over June 2018.
"Even if the home sales edged down last month, our local real estate market is still robust: the year-to-date sales activity saw a 3% increase over June 2018 and a higher level than in any of the first five years of this decade," said Earl Taylor, 2019 LSTAR President.
In London, there were 969 new listings in June and 715 homes exchanged hands, 0.6% more than last year, while the monthly average home price sat at $408,274. In St. Thomas, there were 90 new listings and 73 home sales, 24.7% less than in June 2018, while the average home price was $354,064.
"Looking at all sales-to-new-listings ratios across LSTAR's jurisdiction, we can confidently say that the most of the Association's regions are currently Sellers' markets - with the exception of Middlesex County and Elgin County, which are in a more balanced territory," Taylor stated.
According to reports by the Canadian Real Estate Association (CREA), last month, in London, the median number of days on market for residential properties was ten. In Elgin County, the median number of days on market was 21, in Middlesex County – 13, while in St. Thomas and Strathroy was 11.
Overall, the average home price in the Association’s jurisdiction was $403,382.
|
Area |
JUNE Average Sale Price |
|---|---|
| Elgin County | $335,678 |
| London | $408,274 |
| Middlesex County | $506,178 |
| St. Thomas | $354,064 |
| Strathroy | $370,828 |
| LSTAR | $403,382 |
By geographic area, the average price in London East was $328,025 – up 11% from last June. In London North, the average home sales price was $486,518 – up 1.4% compared to the previous year, while in London South, it was $403,405 – an increase of 8.5% from June 2018. In St. Thomas, it was $354,064 – up 21% over last June.
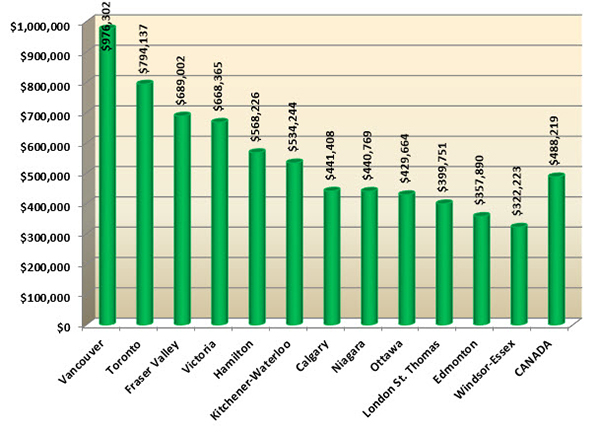
The following chart is based on data taken from the CREA National MLS® Report for May 2019 (the latest CREA statistics available). It provides a snapshot of how average home prices in London and St. Thomas compare to other major Ontario and Canadian centres.
According to a research report1, a total of $67,425 in ancillary expenditures is generated by the average housing transaction in Ontario over a period of three years from the date of purchase. "Based on the home resales in June, that's generating potentially more than 70 million dollars back into the local economy for the next few years," Taylor concluded.
The London and St. Thomas Association of REALTORS® (LSTAR) exists to provide its REALTOR® Members with the support and tools they need to succeed in their profession. LSTAR is one of Canada’s 15 largest real estate associations, representing over 1,700 REALTORS® working in Middlesex and Elgin Counties, a trading area of 500,000 residents. LSTAR adheres to a Quality of Life philosophy, supporting growth that fosters economic vitality, provides housing opportunities, respects the environment and builds good communities and safe neighbourhoods and is a proud participant in the REALTORS Care Foundation’s Every REALTOR™ Campaign.
*These statistics are prepared for LSTAR by the Canadian Real Estate Association (CREA) and represent a data snapshot taken on July 1, 2019, based on processed home sales activity between June 1 and 30, 2019.
1 Economic Impacts of MLS® Systems Home Sales and Purchases in Canada and the Provinces, Altus Group Economic Consulting, 2017.

