The London and St. Thomas Association of REALTORS® (LSTAR) announced 824 homes exchanged hands in February, achieving another monthly record for residential sales. Sales were up more than 19% compared to the same time a year ago, marking the best results ever for February, since the Association began tracking data in 1978.
"This is the sixth consecutive month of record sales, demonstrating just how strong the housing marketplace is right now," said LSTAR 2021 President Jack Lane. “Because of the low supply and high demand, we continue to see increases in average sales price across the entire region."
The following table shows last month’s MLS® Home Price Index (HPI) benchmark prices by area and how they compare to the average sales prices. The HPI benchmark price reflects the value of a "typical home" as assigned by buyers in a certain area based on various housing attributes, while the average sales price is calculated by adding all the sale prices for homes sold and dividing that total by the number of homes sold.
|
Area |
February 2021 MLS® HPI Benchmark Price |
February 2021 Average Price |
|---|---|---|
| Elgin | $524,200 | $609,234 |
| London East | $464,800 | $457,746 |
| London North | $652,100 | $710,269 |
| London South | $527,000 | $651,945 |
| Middlesex | $793,900 | $777,509 |
| St. Thomas | $440,300 | $548,524 |
| Strathroy | $632,000 | $586,564 |
| LSTAR | $536,500 | $616,065 |
"It's important to note average sales price includes all housing types, from two-storey detached homes to high-rise apartment condominiums," Lane said. "The HPI benchmark price is helpful to gauge trends over time because averages may fluctuate by changes in the mix of sales activity from one month to the next."
Inventory is an important measure of the balance between sales and the supply of listings, illustrating how long it would take to liquidate existing inventories at the current rate of sales activity.
"At the end of February, there were 0.6 months of inventory across the entire LSTAR area, lower than 0.8 months of inventory reported at the end of January," Lane said. "Out of the five main areas, St. Thomas had the lowest housing supply, with only 0.4 months of inventory, while Middlesex had the highest supply with 1.1 months," he added.
Another important measure is the sales-to-new listings ratio. "In the month of February, the ratio was 83.3% for LSTAR," Lane said. "A ratio between 40% and 60% is generally consistent with a balanced market, again demonstrating how robust the marketplace is. For those interested in selling their home, it's an opportune time to get in touch with a local REALTOR®."
Single-family homes were the most popular housing type sold in February, with 589 sales. The table below shows the February benchmark prices for all housing types and how they stack up against the values from a year ago.
|
MLS® Home Price Index Benchmark Prices |
||
|---|---|---|
|
Benchmark Type |
February 2021 |
Change over February 2020 |
| LSTAR Composite | $536,500 | ↑ 30.5% |
| LSTAR Single-Family | $591,600 | ↑ 36.3% |
| LSTAR One Storey | $514,400 | ↑ 27.8% |
| LSTAR Two Storey | $669,100 | ↑ 42.3% |
| LSTAR Townhouse | $387,700 | ↑ 14.6% |
| LSTAR Apartment | $296,700 | ↑ 6.4% |
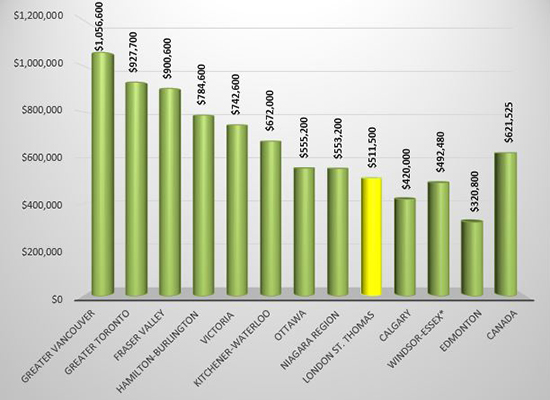
Despite the increases, homes in LSTAR's jurisdiction continue to remain relatively affordable when compared to houses from some other major Ontario and Canadian centres. The following table is based on data taken from the CREA National Price Map for January 2021.
According to a research report[1], a total of $73,250 in ancillary expenditures is generated by the average housing transaction in Ontario over a period of three years from the date of purchase.
"This means that our February home sales could translate into more than $60 million back into the local economy within the next few years," Lane said. "As the economy starts to rebound from the COVID-19 pandemic with the easing of restrictions and the vaccination rollout, real estate can continue to be a major driver to help put the economy on the track to recovery," he concluded.
The London and St. Thomas Association of REALTORS® (LSTAR) exists to provide its REALTOR® Members with the support and tools they need to succeed in their profession. LSTAR is one of Canada’s 10 largest real estate associations, representing over 1,900 REALTORS® working in Middlesex and Elgin Counties, a trading area of 500,000 residents. LSTAR adheres to a Quality of Life philosophy, supporting growth that fosters economic vitality, provides housing opportunities, respects the environment and builds good communities and safe neighbourhoods and is a proud participant in the REALTORS Care Foundation’s Every REALTOR™ Campaign.
*Areas displaying average prices; all other areas displaying MLS® Home Price Index benchmark prices. The benchmark price reflects the value of a “typical home” as assigned by buyers in a certain area based on various housing attributes.
[1] Economic Impacts of MLS® Systems Home Sales and Purchases in Canada and the Provinces, Altus Group, 2019.

