London and St. Thomas Association of REALTORS® (LSTAR) announced 746 homes* were sold in November, up 6.7% over November 2017. The number of home resales was the second highest total ever for November since LSTAR began tracking data in 1978. November 2016 holds the record with 749 home resales, only three more than November 2018.
"In November, we saw more positive signs with new listings in the marketplace, which contributed to the robust sales activity," said Jeff Nethercott, 2018 LSTAR President. "November had 898 new listings, an increase of 17.5% over the same month last year. The area of London East continues to be making healthy gains in both new listings and average sales price. It had 192 new listings, up 24.7 % from November 2017, where the average sales price was $302,737, up 18.7% from 2017 and up 58.9% compared to five years ago. Going back further, that’s up 75.0% compared to 10 years ago."
Average sales price also made steady gains in the major geographic areas in London. In London North, the average sales price was $482,202, up 24.4% from last November and up 62.4% compared to the same month five years ago. It’s an increase of 98.7% compared to the average sales price in 2008.
"Similar to October, we saw inventory (what is called active listings) making slight gains, despite the overall record low inventory that dominated our marketplace this year," Nethercott said. "Last month, LSTAR's jurisdiction had 1,391 active listings, up 7.6% from November 2017. The sales-to-new listings ratio was 83.1%, which the Canadian Real Estate Association (CREA) says represents conditions in the marketplace that favour sellers (a ratio between 40% and 60% is generally consistent with a balanced market). Looking at the major centres, St. Thomas had the highest sales-to-new listings ratio at 97.0%."
A total of 65 homes were sold in November, up 10.2% from November 2017. The average home sales price in St. Thomas was $304,618 up 13.1% from a year ago and up 43.5% compared to five years ago. It’s also up 78.6% from 10 years ago.
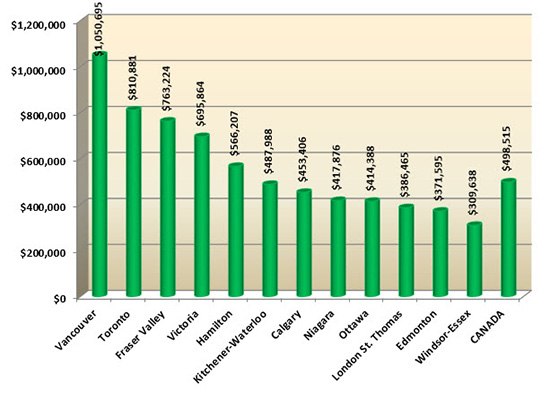
The following chart is based on data taken from the CREA National MLS® Report for October 2018 (the latest CREA statistics available). It provides a snapshot of how average home prices in London and St. Thomas compare to other major Ontario and Canadian centres.
According to a research report1, one job is created for every three real estate transactions and approximately $53,000 in ancillary spending is generated each time a home changes hands in Ontario. “It’s turning out to be another exceptional year for real estate across London and St. Thomas,” Nethercott said. "The business of real estate touches every layer of our regional economy, with November resale activity generating potentially more than $39 million and helping create approximately 248 jobs. The impact to economic growth is priceless."
The London and St. Thomas Association of REALTORS® (LSTAR) exists to provide its REALTOR® Members with the support and tools they need to succeed in their profession. LSTAR is one of Canada’s 15 largest real estate associations, representing over 1,700 REALTORS® working in Middlesex and Elgin Counties, a trading area of 500,000 residents. LSTAR adheres to a Quality of Life philosophy, supporting growth that fosters economic vitality, provides housing opportunities, respects the environment and builds good communities and safe neighbourhoods and is a proud participant in the REALTORS Care Foundation’s Every REALTOR™ Campaign.
*These statistics are prepared for LSTAR by the Canadian Real Estate Association (CREA) and represent a data snapshot taken on December 1, 2018, based on processed home sales activity between November 1 and 30, 2018.
1 Economic Impacts of MLS® System Home Sales and Purchases in Canada and the Provinces, Altus Group Consulting, 2013.

