In April 2025, the London and St. Thomas Association of REALTORS® (LSTAR) reported 653 sales, a 14.3% decrease compared to April 2024. New listings totaled 1,523, reflecting a 10.1% decline year-over-year, while active listings increased by 19.6% to 2,891. The average price of homes was $654,147, a slight 0.5% decrease, from April 2024.
Year-to-date figures show 2,107 sales, a 19.2% drop compared to the same period in 2024. New listings increased slightly by 1.5% to 5,190, while active listings rose by 22.5% to 2,417.
LSTAR Chair Dale Marsh commented on the current market conditions, stating, "The real estate market is facing significant challenges due to economic uncertainties and the impact of tariffs. We are hopeful that the new Canadian government will address the uncertainty caused by tariffs. Although interest rates are favourable, buyers are hesitant to enter the market due to the prevailing uncertainty."
There are positive aspects to consider. The increase in active listings indicates a growing inventory, which can provide more options for buyers and potentially stabilize prices. Additionally, the slight increase in new listings year-to-date suggests that sellers are still entering the market, maintaining a level of activity. Furthermore, the average price of homes remains relatively stable, with only a 0.5% decrease, showing resilience in property values.
The table below displays April’s average prices and MLS® HPI Benchmark Prices in LSTAR's main regions.
Area | April 2025 | April 2025 |
|---|---|---|
| Central Elgin | $648,100 | $641,445 |
| London East | $462,900 | $514,004 |
| London North | $676,500 | $724,739 |
| London South | $587,600 | $684,335 |
| Middlesex Centre | $834,400 | $940,900 |
| St. Thomas | $555,000 | $574,887 |
| Strathroy-Caradoc | $786,800 | $682,149 |
| LSTAR | $589,200 | $654,147 |
The HPI benchmark price reflects the value of a “typical home” as assigned by buyers in a certain area based on various housing attributes, while the average sales price is calculated by adding all the sale prices for homes sold and dividing that total by the number of homes sold. The HPI benchmark price is helpful to gauge trends over time since averages may fluctuate by changes in the mix of sales activity from one month to the next.
In April 2025, the MLS® Home Price Index Benchmark Prices for the LSTAR region mostly declined compared to March 2025, with drops in the Composite, Single-Family, One Storey, and Two Storey Benchmark Prices. The Townhouse Benchmark Price remained stable, while the Apartment Benchmark Price increased.
For Buyers: This decline in prices may present an opportunity to purchase homes at lower prices compared to previous months, particularly for single-family and one-storey properties. The increase in apartment prices suggests a growing demand for more affordable housing options, which could be beneficial for first-time buyers or those looking for smaller properties. The stable townhouse prices indicate a consistent market segment that might offer reliable investment opportunities.
For Sellers: Sellers may face challenges due to the overall decline in benchmark prices, which could affect their potential returns. However, the increase in apartment prices and stable townhouse prices could be advantageous for those selling these types of properties. Sellers might need to adjust their expectations and pricing strategies to align with current market conditions and attract buyers.
The following table displays April’s benchmark prices for all housing types within LSTAR's jurisdiction and shows how they compare with those recorded in the previous month and three months ago.
MLS® Home Price Index Benchmark Prices | |||
|---|---|---|---|
| Benchmark Type | April 2025 | Change Over March 2025 | Change Over January 2025 |
| LSTAR Composite | $589,200 | ↓4.1% | ↓4.6% |
| LSTAR Single-Family | $641,100 | ↓3.8% | ↓3.6% |
| LSTAR One Storey | $583,300 | ↓4.9% | ↓2.5% |
| LSTAR Two Storey | $688,600 | ↓3.1% | ↓4.4% |
| LSTAR Townhouse | $489,100 | 0.0% | ↓0.6% |
| LSTAR Apartment | $393,800 | ↑4.0% | ↓4.2% |
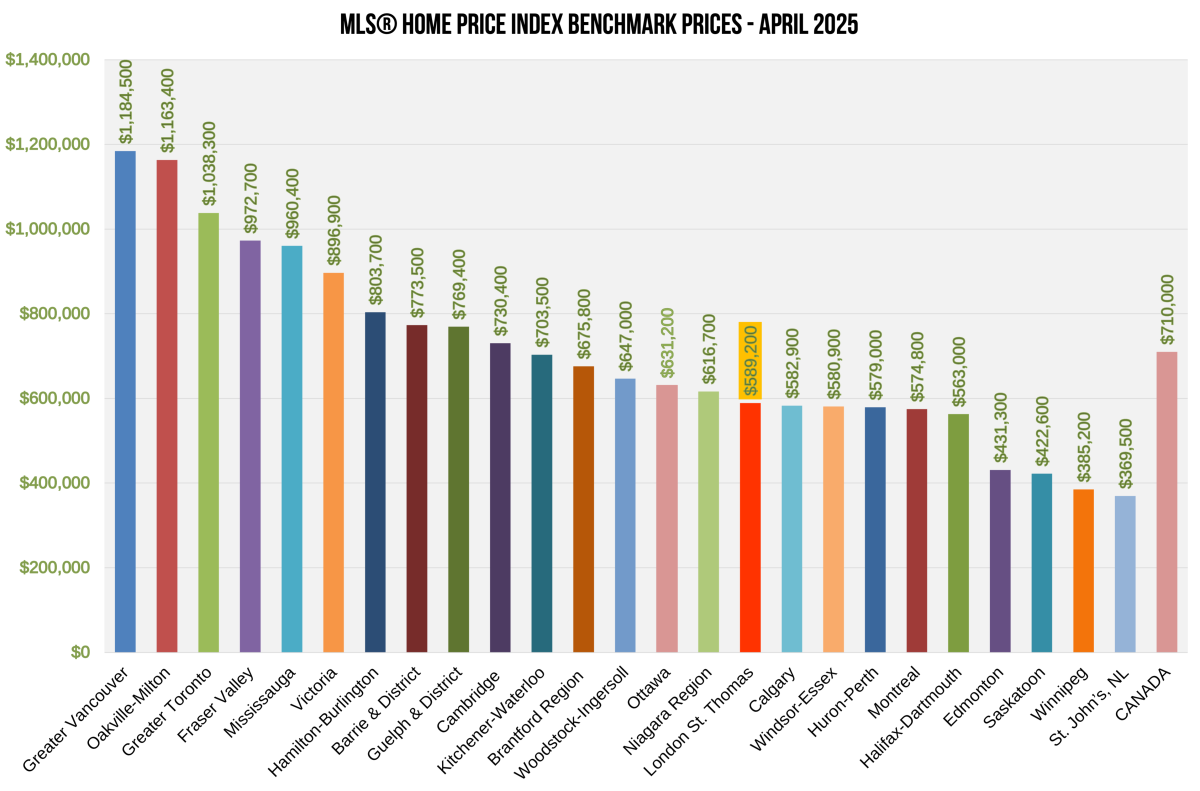
The chart below shows the most recent HPI benchmark prices across Canada. Vancouver has now overtaken Oakville with the highest home price in Canada, with a MLS® Home Price Index Benchmark Price of $1,184,500.
According to a recent study1 by Altus Group, an average housing transaction in Ontario generated an average of $88,966 in spin-off spending per transaction from 2020 to 2022. These expenses include legal fees, appraisers, moving costs, new appliances, and home renovation expenses.
Employment resulting from home sales is also significant, according to the Altus study. Resale housing activity created an estimated 106,565 jobs annually in Ontario from 2020 to 2022. Jobs include manufacturing, construction, finance and insurance.
1Economic Benefits Generated by Home Sales and Purchases Over MLS® Systems in Canada, Altus Group, 2023.

