636 homes were sold last month via the MLS® System of the London and St. Thomas Association of REALTORS® (LSTAR), 11.3% less than in March 2023. The number of newly listed properties surged from 1,024 in February to 1,233 in March, marking an 11.8% increase over a year ago.
“For LSTAR, this was the March with the lowest number of home sales in the last decade, partly because of the statutory holiday Good Friday, which fell at the end of the month this year, and not in April, as usual," said 2024 LSTAR Chair Kathy Amess. “However, the number of new listings was in line with the Association’s ten-year average for the month of March,” she pointed out.
Out of the 636 homes exchanging hands in March in LSTAR’s jurisdiction, 449 were single-family homes, 103 were townhouses, and 63 – apartments. The average price for a single-family home in the London-St. Thomas area rose from $682,780 in February to $708,044 last month, while that of a townhouse climbed from $507,229 to in February to $531,369 last month. The average price of an apartment from our region surged from $382,496 in February to $403,560 in March. “In addition, the average prices for townhouses and apartments saw slight year-over-year gains, rising by 1.7% and 4.9% respectively,” Amess observed. “However, when compared to March 2023, the average price of a single-family home from our area decreased by 0.2%,” she added.
Overall, the housing supply increased slightly in our region - from 2.7 months of inventory in February to 2.9 months in March.
"LSTAR’s sales-to-new listings ratio sat at 51.6% last month, indicating a highly balanced real estate market," Amess said.
The average home price for the entire jurisdiction of LSTAR saw a healthy month-over-month growth – from $617,790 in February to $646,155 last month – but was 0.2% lower than in March 2023. However, the Composite MLS® Home Price Index (HPI) Benchmark Price posted month-over-month and year-over-year increases – of 2.6%, and 1.6% respectively - hiking to $602,700.
The table below displays an analysis of March's average and MLS® HPI Benchmark prices in LSTAR's main regions.
Area | March 2024 MLS® | March 2024 |
|---|---|---|
| Central Elgin | $627,700 | $618,700 |
| London East | $491,900 | $512,372 |
| London North | $706,300 | $716,694 |
| London South | $600,800 | $662,711 |
| Middlesex Centre | $852,000 | $986,733 |
| St. Thomas | $538,500 | $572,837 |
| Strathroy-Caradoc | $748,000 | $680,493 |
| LSTAR | $602,700 | $646,155 |
“When looking at last month’s figures, it’s essential to understand the difference between average prices and MLS® benchmark prices. The latter reflects the image of a 'typical home' from a specific area as perceived by the local home buyers, unveiling, at the same time, what housing attributes these buyers value the most. In contrast, the average sales price is calculated by adding all home sale prices and dividing the total sum by the number of homes sold.
Because average prices can experience high fluctuations from one month to the next, due to only a few outliers from the sales activity mix, the HPI benchmark price is a more reliable tool for tracking trends over time,” Amess stated.
The following table shows March’s benchmark prices for all housing types within LSTAR's jurisdiction and how they compare with those recorded in the previous month and three months ago.
MLS® Home Price Index Benchmark Prices | |||
|---|---|---|---|
| Benchmark Type | March 2024 | Change Over February 2024 | Change Over December 2023 |
| LSTAR Composite | $602,700 | ↑2.6% | ↑5.5% |
| LSTAR Single-Family | $649,000 | ↑2.4% | ↑5.2% |
| LSTAR One Storey | $585,800 | ↑2.1% | ↑3.6% |
| LSTAR Two Storey | $695,800 | ↑2.5% | ↑6.3% |
| LSTAR Townhouse | $499,400 | ↑5.3% | ↑5.5% |
| LSTAR Apartment | $389,700 | ↑0.9% | ↑9.7% |
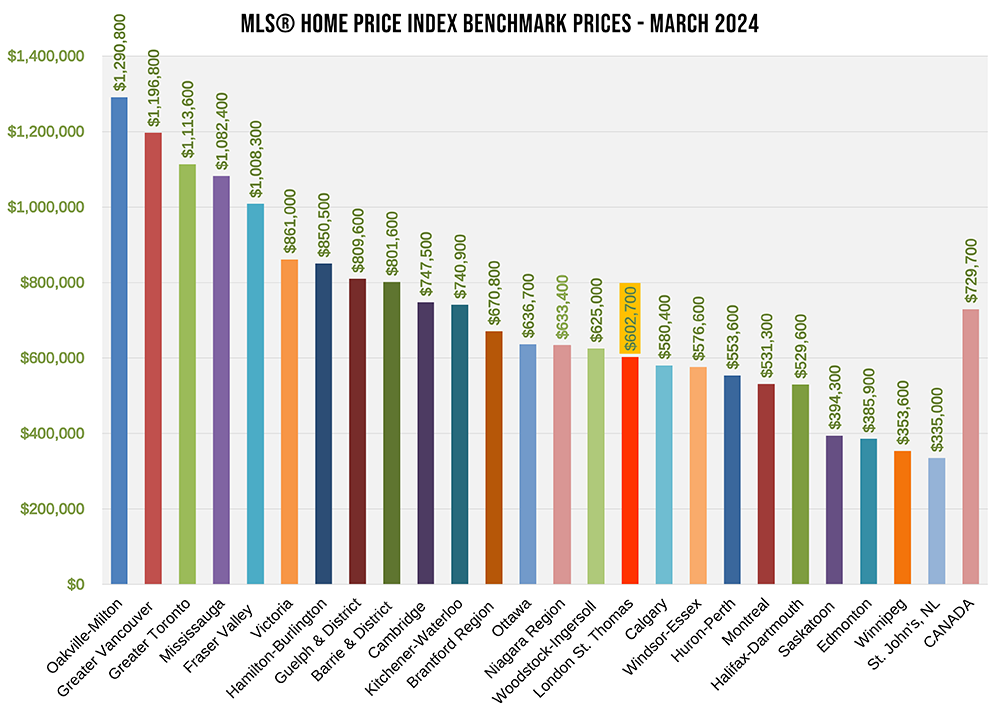
"When compared to the prices recorded in other provincial and national centres, homes within the LSTAR jurisdiction appear relatively affordable, positioning our region as an attractive housing market," Amess said. The table below shows the most recent HPI benchmark prices, as provided by CREA.
According to a recent study1 by Altus Group, an average housing transaction in Ontario prompts approximately $77,420 in spin-off spending within three years from the date of the home purchase. These expenses include legal fees, moving costs, furniture acquisitions, and home improvement expenses, as well as some other charges.
“This means that, through the secondary spending they are generating, LSTAR’s March home sales could potentially bring over $49 million to the local coffers over the next three years. This goes to show why the real estate industry is considered one of the main drivers of the local economy," Amess concluded.
1Economic Impacts of MLS® Systems Home Sales and Purchases in Canada and the Provinces, Altus Group, 2019.

