In July, 725 homes exchanged hands via the MLS® System of the London and St. Thomas Association of REALTORS® (LSTAR), up 28.1% compared to the same month a year ago. That’s the best month of sales for July since 2021.
“Historically we see less activity during the summer season, so these numbers are very encouraging,” said Dale Marsh, 2025 LSTAR Chair. “The housing market continues the pattern reflected over the last few months, with more new listings and robust inventory. The overall sales-to-new listing ratio was 44.6%, which the Canadian Real Estate Association (CREA) would indicate as a balanced market.”
Average sales price was in line with June, coming in at $648,273, down just 0.6% compared to July 2024. Meanwhile, the Composite MLS® Home Price Index (HPI) Benchmark Price was $578,900, down 0.3% from a month ago.
The table below displays July’s average prices and MLS® HPI Benchmark Prices in LSTAR's main regions.
Area | July 2025 | July 2025 |
|---|---|---|
| Central Elgin | $619,600 | $586,309 |
| London East | $453,100 | $516,915 |
| London North | $664,200 | $739,629 |
| London South | $577,400 | $656,633 |
| Middlesex Centre | $806,300 | $941,296 |
| St. Thomas | $534,500 | $550,165 |
| Strathroy-Caradoc | $801,100 | $648,867 |
| LSTAR | $578,900 | $648,273 |
"The Bank of Canada held its policy rate at 2.75% last week, as the trade relationship with the U.S. remains unpredictable,” Marsh said. “Housing is local. During these uncertain times, you can count on an LSTAR REALTOR® to help you manage the marketplace, at any point in your journey on the housing continuum.”
The HPI benchmark price reflects the value of a “typical home” as assigned by buyers in a certain area based on various housing attributes, while the average sales price is calculated by adding all the sale prices for homes sold and dividing that total by the number of homes sold. The HPI benchmark price is helpful to gauge trends over time since averages may fluctuate by changes in the mix of sales activity from one month to the next.
The following table displays July’s benchmark prices for all housing types within LSTAR's jurisdiction and shows how they compare with those recorded in the previous month and three months ago.
MLS® Home Price Index Benchmark Prices | |||
|---|---|---|---|
| Benchmark Type | July 2025 | Change Over June 2025 | Change Over April 2025 |
| LSTAR Composite | $578,900 | ↓0.3% | ↓1.7% |
| LSTAR Single-Family | $632,800 | ↓0.3% | ↓1.3% |
| LSTAR One Storey | $573,700 | ↓0.9% | ↓1.5% |
| LSTAR Two Storey | $680,800 | 0.0% | ↓0.9% |
| LSTAR Townhouse | $473,100 | ↓0.9% | ↓3.5% |
| LSTAR Apartment | $366,000 | ↑0.5% | ↓7.1% |
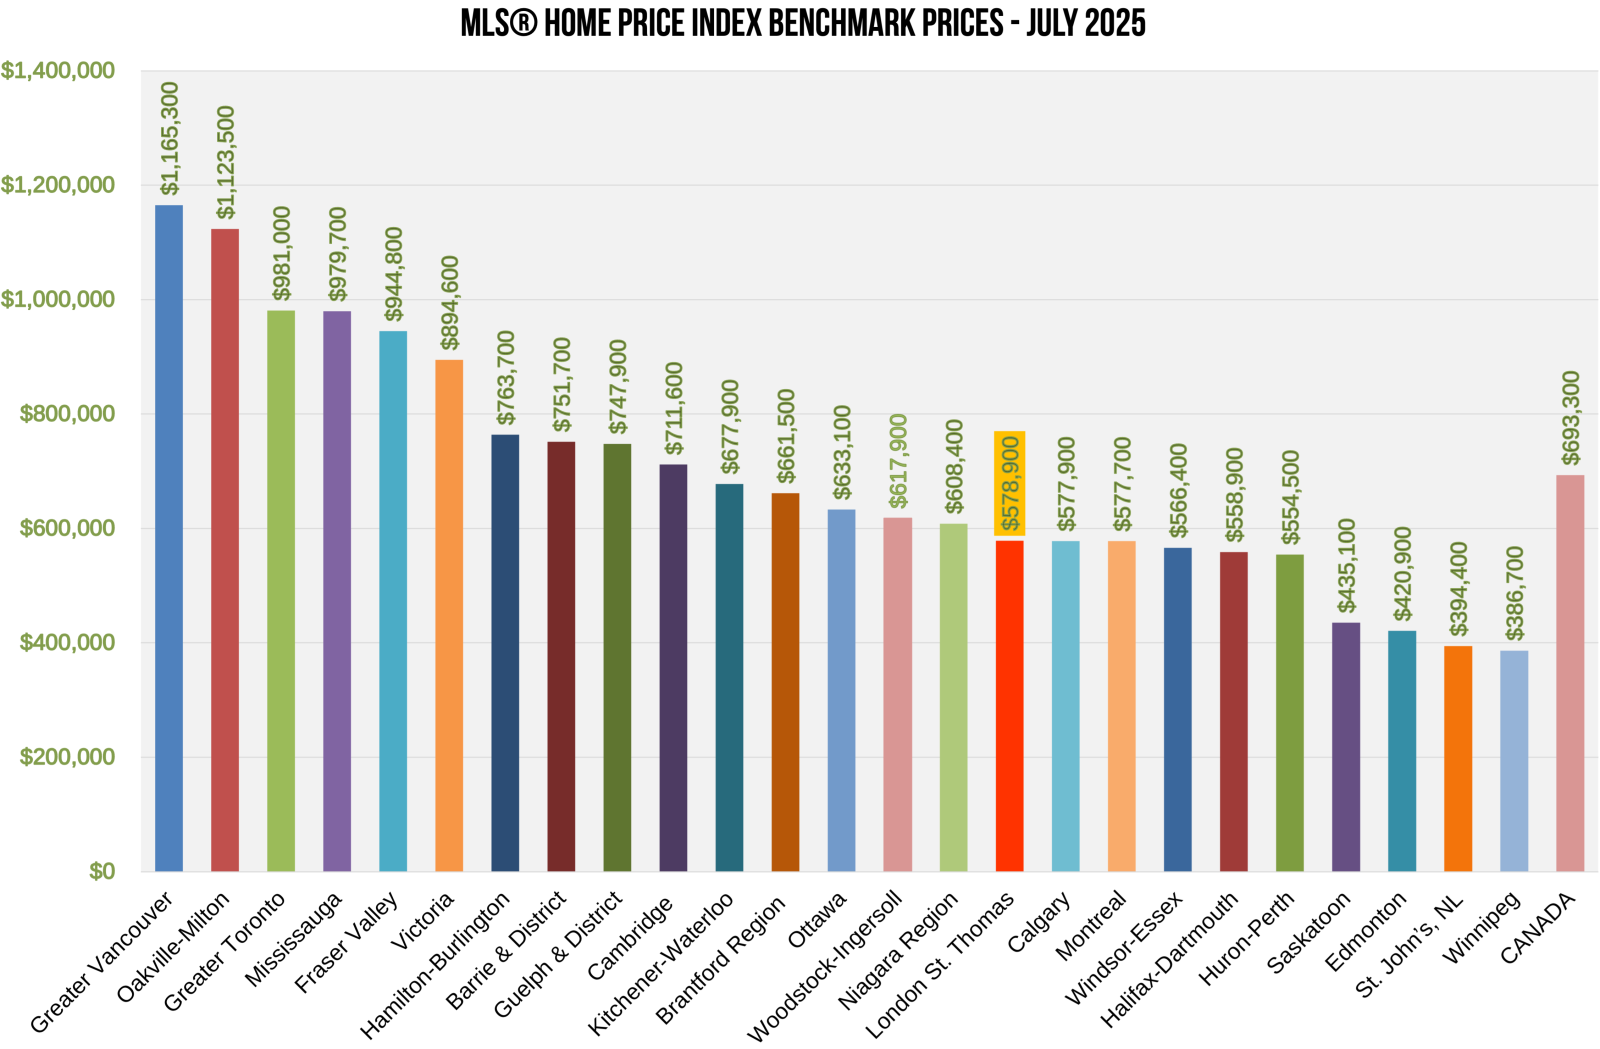
The chart below shows the most recent HPI benchmark prices across the country, courtesy of CREA. “When compared to other provincial and national centres, homes within LSTAR’s region appear competitive for buyers,” Marsh said.
According to a recent study1 by Altus Group, an average housing transaction in Ontario generated an average of $88,966 in spin-off spending per transaction from 2020 to 2022. These expenses include legal fees, appraisers, moving costs, new appliances, and home renovation expenses.
“Real estate plays a huge role in our local economy, with home sales in July potentially generating more than $64 million,” Marsh said.
Employment resulting from home sales is also significant, according to the Altus study. Resale housing activity created an estimated 106,565 jobs annually in Ontario from 2020 to 2022. Jobs include manufacturing, construction, finance and insurance.
1Economic Benefits Generated by Home Sales and Purchases Over MLS® Systems in Canada, Altus Group, 2023.

