In May 2023, 1,397 new listings came on the local market and 846 homes exchanged hands via the MLS® System of the London and St. Thomas Association of REALTORS® (LSTAR). While the number of new listings is 23.9% lower than in May 2022, the number of sales is 1.3% higher than a year ago.
LSTAR's overall sales-to-new listings ratio for the entire area stood at 60.6% last month. Moreover, the inventory continued to decline, dwindling from 1.8 months in April to a mere 1.7 months in May.
"The month-over-month increases in home sales and prices continued in May in LSTAR's jurisdiction, thus indicating a further rebound of the local real estate market," said 2023 LSTAR President Adam Miller. "Throughout the last three months of 2023, an upward trajectory in the quantity of residential property sales and corresponding price hikes has persistently caught our attention. These trends demonstrate the enduring presence of a fervent demand for properties in our area, despite the obvious lack of housing supply," Miller added.
The table below highlights the average home prices in LSTAR's primary regions for May, comparing them to the benchmark prices in those same areas.
| Area | May 2023 MLS® HPI Benchmark Price | May 2023 Average Price |
|---|---|---|
| Central Elgin | $644,500 | $781,982 |
| London East | $508,100 | $527,848 |
| London North | $730,400 | $753,265 |
| London South | $617,900 | $682,189 |
| Middlesex Centre | $863,000 | $972,914 |
| St. Thomas | $543,100 | $599,781 |
| Strathroy-Caradoc | $762,700 | $683,989 |
| LSTAR | $619,800 | $682,561 |
Despite a 10% decrease in LSTAR's average home price and an 11.9% decline in the composite MLS® Home Price Index (HPI) Benchmark Price compared to the same period last year, these figures showed improvement compared to earlier this year. The average home price in May 2023 reached $682,561, while the composite MLS® HPI Benchmark Price sat at $619,800.
Furthermore, the table below presents the May benchmark prices for all housing types within LSTAR's jurisdiction, showcasing a comparison between current values, those from the previous year, and those from six months ago.
|
|
|||
|---|---|---|---|
| Benchmark Type | May 2023 | Change Over May 2022 | Change Over January 2023 |
| LSTAR Composite | $619,800 | ↓11.9% | ↑7.4% |
| LSTAR Single-Family | $666,900 | ↓11.1% | ↑8.2% |
| LSTAR One Storey | $607,000 | ↓11.1% | ↑7.7% |
| LSTAR Two Storey | $708,500 | ↓11.0% | ↑8.6% |
| LSTAR Townhouse | $513,400 | ↓15.2% | ↑5.2% |
| LSTAR Apartment | $394,000 | ↓15.0% | ↑0.9% |
In terms of housing preferences, the single-family home remained the top choice among local buyers, with 608 units sold, followed by 128 condo townhouses and 68 apartments. "Notably, condo and apartment sales experienced substantial year-over-year increases in May, rising by 18.5% and 13.3%, respectively. Additionally, apartments saw the smallest decline in average price compared to the previous year," Miller noted.
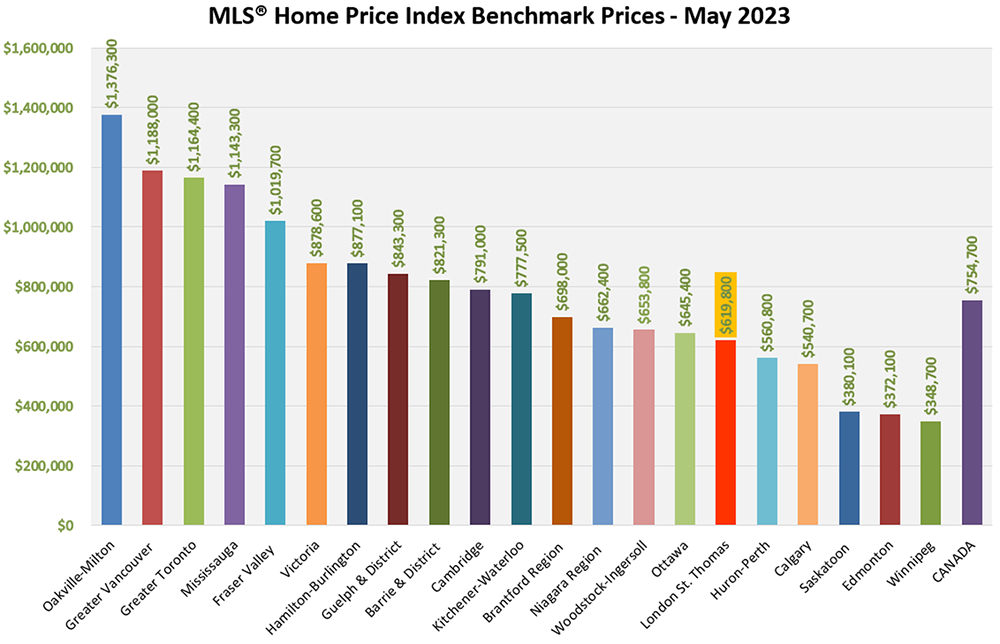
"Despite fluctuations, homes in our area continue to offer relative affordability when compared to provincial and national values." Citing data from the Canadian Real Estate Association (CREA), Miller referred to the most recent HPI benchmark prices for May, available in the chart below.
According to a research report1 conducted by Altus Group, the average housing transaction in Ontario generates $73,250 in ancillary expenditures over a period of three years from the purchase date. These expenditures encompass a wide range of costs, including, but not limited to, legal fees, moving expenses, furniture purchases, and renovation costs. "Based on this figure, the home sales recorded by LSTAR in May 2023 have the potential to bring almost $62 million in spin-off spending to our local economy by 2026," stated Miller.
"These figures illustrate the significant financial impact the housing market can have on both homebuyers and the broader economy," Miller concluded.
1Economic Impacts of MLS® Systems Home Sales and Purchases in Canada and the Provinces, Altus Group, 2019

