In July 2023, 640 homes were sold via the MLS® System of the London and St. Thomas Association of REALTORS® (LSTAR), 19.6% more than in the seventh month of last year. The local housing supply increased from 2.2 months of inventory in June to 2.9 months in July. During the same period, 1,333 new listings came on the market, up by 8.2% over 2022. “In July 2023, LSTAR’s overall sales-to-new-listings ratio sat at 48%, indicating a fairly balanced market,” said 2023 LSTAR President Adam Miller.
“The higher borrowing costs triggered by Bank of Canada’s latest hike in its benchmark interest rate barely put a dent in July’s home sales and prices,” Miller noted. “This speaks not only to the local market’s appeal and resilience, but also to the huge demand for housing sparked by the increased immigration, which, according to a recent study, reached unprecedented levels in the last twelve months,” he added.
The following table shows the average and MLS® HPI Benchmark Prices recorded last month in LSTAR’s main regions.
|
|
|
|
|---|---|---|
| Central Elgin | $637,300 | $694,595 |
| London East | $496,100 | $505,226 |
| London North | $727,400 | $750,787 |
| London South | $608,800 | $648,835 |
| Middlesex Centre | $869,200 | $1,308,286 |
| St. Thomas | $541,900 | $621,991 |
| Strathroy-Caradoc | $748,300 | $652,303 |
| LSTAR | $612,800 | $668,821 |
July’s overall average home price came in at $668,821, slightly lower than in the previous month, but 1.7% higher than a year ago. LSTAR’s composite MLS® HPI Benchmark Price was $612,800, 2.1% down from June, but 6.1% up when compared to six months ago.
“While the average sales price is calculated by adding all the sale prices for all types of homes sold and dividing that sum by the total number of units sold, the HPI benchmark price reflects the value of a “typical home” as seen by the local buyers based on various housing features. Since averages may be skewed by only a handful of high-end sales recorded over one month, the HPI benchmark prices can better help us identify price trends,” Miller explained.
The table below shows the July benchmark prices for all housing types within LSTAR's jurisdiction, comparing changes from the previous month and six months ago.
|
|
|||
|---|---|---|---|
| Benchmark Type | July 2023 | Change Over June 2023 | Change Over 6 Months Ago |
| LSTAR Composite | $612,800 | ↓2.1% | ↑6.1% |
| LSTAR Single-Family | $657,500 | ↓2.5% | ↑6.5% |
| LSTAR One Storey | $594,000 | ↓2.7% | ↑6.6% |
| LSTAR Two Storey | $702,500 | ↓2.3% | ↑6.6% |
| LSTAR Townhouse | $516,900 | ↓0.7% | ↑5.1% |
| LSTAR Apartment | $392,800 | 0.0% | ↑3.6% |
In terms of housing preferences, in July, the best-selling house style in LSTAR’s jurisdiction was the single-family home, with 471 units exchanging hands. Condominium townhouses ranked second, with 110 units sold, followed by apartments, with 51 units sold.
In July, the average price of a single-family home located in LSTAR’s jurisdiction stood at $734,234, while that of a condo townhouse was $546,569. The average price of an apartment sat at $383,647.
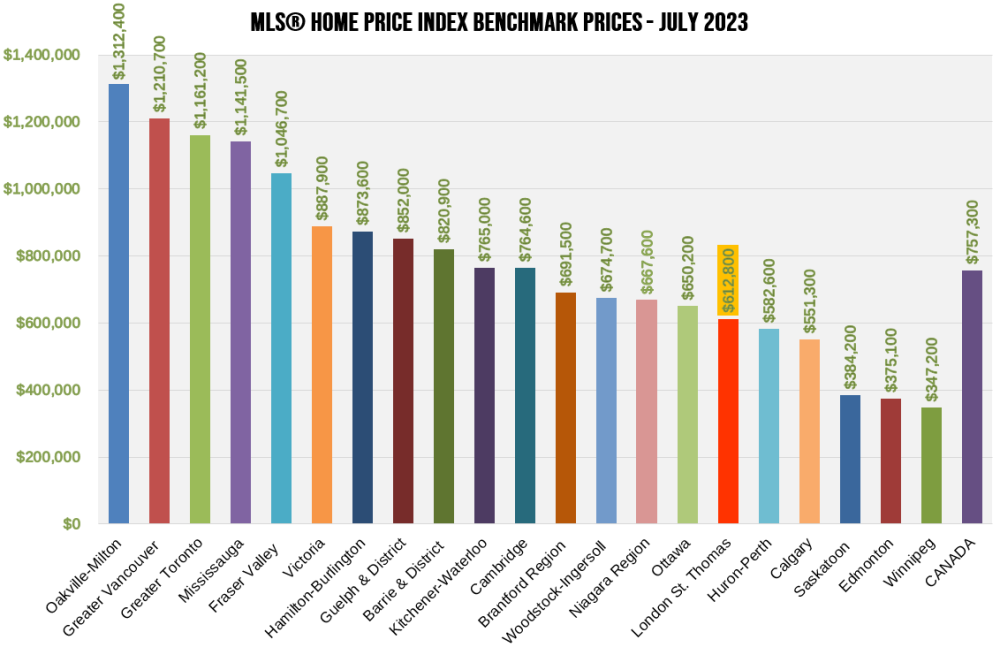
"Despite London being identified as the most competitive housing market in Ontario, homes in LSTAR's jurisdiction continue to maintain their affordability compared to other major Ontario and Canadian centers.” Miller said. The following chart shows the latest HPI benchmark prices, courtesy of CREA.
A 2019 research study1 conducted by Altus Group shows that the average housing transaction in Ontario generates approximately $77,420 in ancillary expenditures over a period of three years from the purchase date. These expenditures encompass a wide range of costs, which include, but are not limited to, legal fees, moving expenses, furniture purchases, and renovation costs. "This means the home sales recorded by LSTAR in July can potentially bring more than $49 million back to the local economy by 2026," Miller concluded.
1Economic Impacts of MLS® Systems Home Sales and Purchases in Canada and the Provinces, Altus Group, 2019

