The London and St. Thomas Association of REALTORS® (LSTAR) has released its May 2025 residential market report, reflecting a market in transition amid broader economic pressures, including the ongoing impact of US tariffs.
In May, 722 homes were sold—a 15.4% decline from May 2024. Meanwhile, new listings rose 15.3% to 1,999, and active listings climbed 26.5% to 3,253, offering buyers a wider selection of properties.
“The increase in listings is encouraging for buyers,” said Dale Marsh, 2025 LSTAR Chair. “However, economic uncertainty, particularly from US tariffs, continues to influence market behavior.”
The average home price reached $656,432, up 1.4% year-over-year, signaling steady demand. Inventory levels also rose, with 4.5 months of supply, pointing to a more balanced market.
“Despite softer sales, the market remains resilient,” Marsh added. “Rising inventory and stable prices suggest opportunities for both buyers and sellers. Staying informed and adaptable is key in this evolving landscape.”
Overall, the region’s real estate market is adjusting to shifting conditions, showing signs of stability and adaptability in the face of external economic challenges.
The table below displays May’s average prices and MLS® HPI Benchmark Prices in LSTAR's main regions.
Area | May 2025 | May 2025 |
|---|---|---|
| Central Elgin | $638,900 | $689,474 |
| London East | $468,400 | $524,701 |
| London North | $682,000 | $742,398 |
| London South | $589,700 | $649,905 |
| Middlesex Centre | $843,600 | $979,397 |
| St. Thomas | $545,700 | $564,737 |
| Strathroy-Caradoc | $823,100 | $679,453 |
| LSTAR | $593,900 | $656,432 |
The HPI benchmark price reflects the value of a “typical home” as assigned by buyers in a certain area based on various housing attributes, while the average sales price is calculated by adding all the sale prices for homes sold and dividing that total by the number of homes sold. The HPI benchmark price is helpful to gauge trends over time since averages may fluctuate by changes in the mix of sales activity from one month to the next.
In May 2025, the MLS® Home Price Index Benchmark Price for the London and St. Thomas area showed varied trends across different property types. The composite benchmark price was $593,900, reflecting a slight increase of 0.8% from the previous month but a decrease of 4.5% over three months and 2.2% over twelve months. Single-family homes had a benchmark price of $651,500, with a 1.6% rise from last month but a 13.6% drop over three years. One-storey homes saw the most significant monthly increase at 3.5%, reaching $602,700, while two-storey homes had a modest 0.6% rise to $691,700. Townhouses and apartments experienced declines, with benchmark prices of $488,200 and $369,500 respectively, indicating a challenging market for these property types. Over a five-year period, one-storey homes showed the highest growth at 55.9%, highlighting long-term appreciation in this segment.
The following table displays May’s benchmark prices for all housing types within LSTAR's jurisdiction and shows how they compare with those recorded in the previous month and three months ago.
MLS® Home Price Index Benchmark Prices | |||
|---|---|---|---|
| Benchmark Type | May 2025 | Change Over April 2025 | Change Over February 2025 |
| LSTAR Composite | $593,900 | ↑0.8% | ↓4.5% |
| LSTAR Single-Family | $651,500 | ↑1.6% | ↓3.3% |
| LSTAR One Storey | $602,700 | ↑3.54% | ↓0.9% |
| LSTAR Two Storey | $691,700 | ↑0.6% | ↓5.0% |
| LSTAR Townhouse | $488,200 | ↓0.4% | ↓1.8% |
| LSTAR Apartment | $369,500 | ↓6.2% | ↓2.7% |
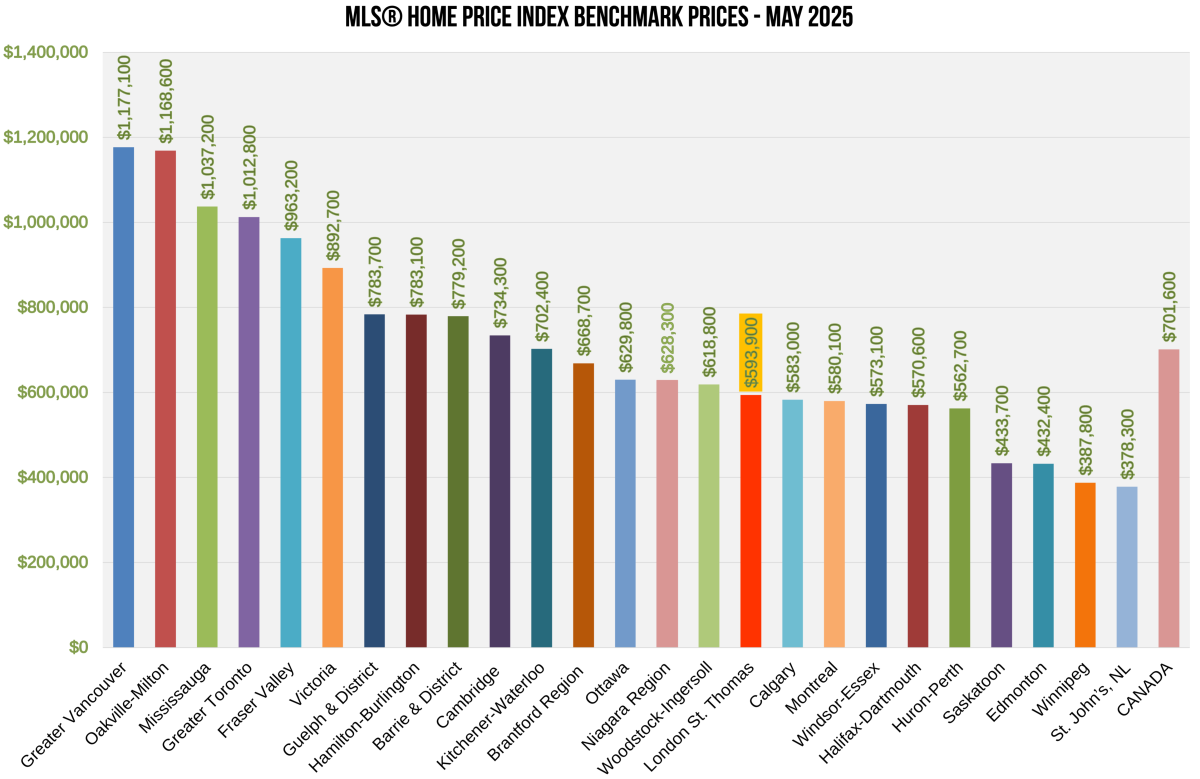
The chart below shows the most recent HPI benchmark prices across Canada. For the second month in a row Vancouver has overtaken Oakville with the highest home price in Canada.
According to a recent study1 by Altus Group, an average housing transaction in Ontario generated an average of $88,966 in spin-off spending per transaction from 2020 to 2022. These expenses include legal fees, appraisers, moving costs, new appliances, and home renovation expenses.
Employment resulting from home sales is also significant, according to the Altus study. Resale housing activity created an estimated 106,565 jobs annually in Ontario from 2020 to 2022. Jobs include manufacturing, construction, finance and insurance.
1Economic Benefits Generated by Home Sales and Purchases Over MLS® Systems in Canada, Altus Group, 2023.

